|
Download Data (XLS File) |
|
||||||||
|
||||||||
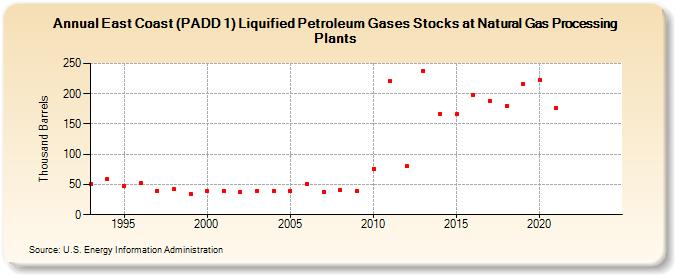
| East Coast (PADD 1) Liquified Petroleum Gases Stocks at Natural Gas Processing Plants (Thousand Barrels) | ||||||||
| Decade | Year-0 | Year-1 | Year-2 | Year-3 | Year-4 | Year-5 | Year-6 | Year-7 | Year-8 | Year-9 |
|---|---|---|---|---|---|---|---|---|---|---|
| 1990's | 51 | 59 | 48 | 52 | 40 | 42 | 34 | |||
| 2000's | 39 | 40 | 38 | 40 | 40 | 40 | 51 | 38 | 41 | 39 |
| 2010's | 76 | 221 | 80 | 238 | 167 | 166 | 198 | 188 | 180 | 216 |
| 2020's | 222 | 176 | -- | -- |
| - = No Data Reported; -- = Not Applicable; NA = Not Available; W = Withheld to avoid disclosure of individual company data. |
| Release Date: 3/29/2024 |
| Next Release Date: 8/30/2024 |