|
Download Data (XLS File) |
|
||||||||
|
||||||||
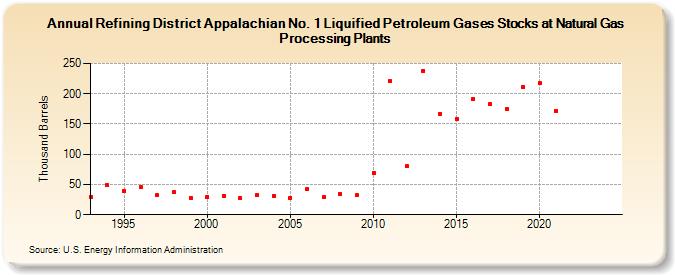
| Refining District Appalachian No. 1 Liquified Petroleum Gases Stocks at Natural Gas Processing Plants (Thousand Barrels) | ||||||||
| Decade | Year-0 | Year-1 | Year-2 | Year-3 | Year-4 | Year-5 | Year-6 | Year-7 | Year-8 | Year-9 |
|---|---|---|---|---|---|---|---|---|---|---|
| 1990's | 30 | 49 | 40 | 46 | 32 | 37 | 28 | |||
| 2000's | 30 | 31 | 27 | 32 | 31 | 28 | 42 | 29 | 34 | 32 |
| 2010's | 69 | 221 | 80 | 238 | 167 | 159 | 192 | 183 | 175 | 211 |
| 2020's | 217 | 172 | -- | -- |
| - = No Data Reported; -- = Not Applicable; NA = Not Available; W = Withheld to avoid disclosure of individual company data. |
| Release Date: 3/29/2024 |
| Next Release Date: 8/30/2024 |