|
Download Data (XLS File) |
|
||||||||
|
||||||||
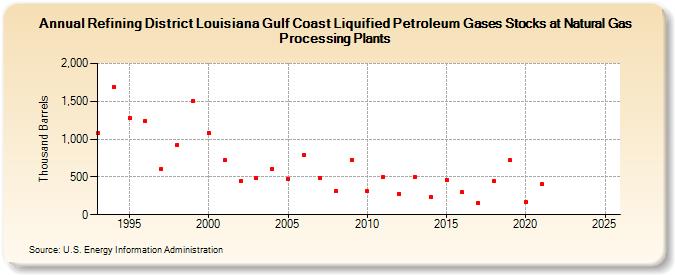
| Refining District Louisiana Gulf Coast Liquified Petroleum Gases Stocks at Natural Gas Processing Plants (Thousand Barrels) | ||||||||
| Decade | Year-0 | Year-1 | Year-2 | Year-3 | Year-4 | Year-5 | Year-6 | Year-7 | Year-8 | Year-9 |
|---|---|---|---|---|---|---|---|---|---|---|
| 1990's | 1,077 | 1,693 | 1,281 | 1,242 | 604 | 928 | 1,506 | |||
| 2000's | 1,087 | 721 | 447 | 479 | 608 | 473 | 787 | 492 | 311 | 730 |
| 2010's | 310 | 499 | 279 | 504 | 228 | 463 | 294 | 155 | 447 | 718 |
| 2020's | 170 | 400 | -- | -- |
| - = No Data Reported; -- = Not Applicable; NA = Not Available; W = Withheld to avoid disclosure of individual company data. |
| Release Date: 4/30/2024 |
| Next Release Date: 8/30/2024 |