|
Download Data (XLS File) |
|
||||||||
|
||||||||
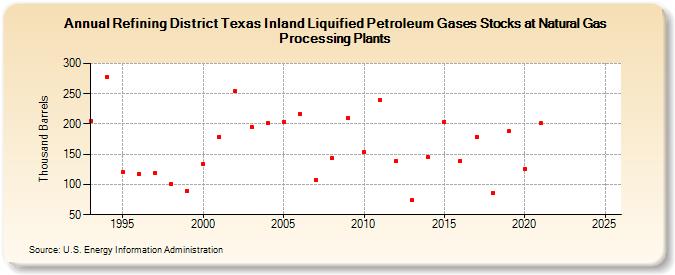
| Refining District Texas Inland Liquified Petroleum Gases Stocks at Natural Gas Processing Plants (Thousand Barrels) | ||||||||
| Decade | Year-0 | Year-1 | Year-2 | Year-3 | Year-4 | Year-5 | Year-6 | Year-7 | Year-8 | Year-9 |
|---|---|---|---|---|---|---|---|---|---|---|
| 1990's | 205 | 278 | 120 | 117 | 119 | 101 | 90 | |||
| 2000's | 134 | 179 | 254 | 195 | 201 | 203 | 217 | 108 | 144 | 210 |
| 2010's | 153 | 240 | 139 | 74 | 145 | 204 | 139 | 179 | 86 | 188 |
| 2020's | 126 | 201 | -- | -- |
| - = No Data Reported; -- = Not Applicable; NA = Not Available; W = Withheld to avoid disclosure of individual company data. |
| Release Date: 8/30/2024 |
| Next Release Date: 8/29/2025 |