|
Download Data (XLS File) |
|
||||||||
|
||||||||
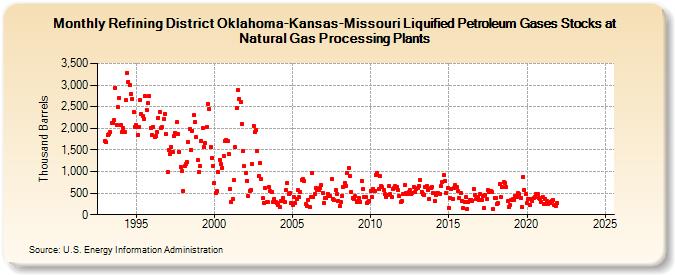
| Refining District Oklahoma-Kansas-Missouri Liquified Petroleum Gases Stocks at Natural Gas Processing Plants (Thousand Barrels) | ||||||||
| Year | Jan | Feb | Mar | Apr | May | Jun | Jul | Aug | Sep | Oct | Nov | Dec |
|---|---|---|---|---|---|---|---|---|---|---|---|---|
| 1993 | 1,710 | 1,677 | 1,855 | 1,865 | 1,910 | 2,120 | 2,122 | 2,184 | 2,940 | 2,086 | 2,482 | 2,712 |
| 1994 | 2,082 | 1,913 | 2,001 | 1,918 | 2,649 | 3,288 | 3,074 | 3,012 | 2,803 | 2,686 | 2,379 | 2,037 |
| 1995 | 2,071 | 1,845 | 2,039 | 2,653 | 2,333 | 2,275 | 2,220 | 2,742 | 2,426 | 2,575 | 2,739 | 2,006 |
| 1996 | 1,841 | 2,033 | 1,805 | 1,814 | 1,925 | 2,245 | 2,387 | 2,002 | 2,019 | 2,210 | 2,337 | 1,863 |
| 1997 | 977 | 1,505 | 1,397 | 1,570 | 1,461 | 1,813 | 1,896 | 2,138 | 1,865 | 1,461 | 1,109 | 1,015 |
| 1998 | 549 | 1,119 | 1,172 | 1,213 | 1,688 | 1,981 | 1,508 | 1,944 | 2,306 | 2,141 | 1,798 | 1,262 |
| 1999 | 995 | 1,121 | 1,708 | 1,997 | 1,559 | 1,651 | 2,031 | 2,569 | 2,438 | 1,559 | 1,313 | 1,137 |
| 2000 | 734 | 508 | 547 | 987 | 1,277 | 1,169 | 1,090 | 1,362 | 1,707 | 1,740 | 1,702 | 1,403 |
| 2001 | 592 | 288 | 359 | 793 | 1,557 | 2,470 | 2,886 | 2,685 | 2,602 | 2,107 | 1,484 | 1,119 |
| 2002 | 962 | 786 | 422 | 557 | 583 | 1,163 | 2,063 | 1,919 | 1,956 | 1,467 | 888 | 1,201 |
| 2003 | 838 | 377 | 275 | 616 | 284 | 298 | 638 | 544 | 522 | 287 | 375 | 293 |
| 2004 | 267 | 231 | 189 | 320 | 315 | 385 | 286 | 575 | 737 | 486 | 500 | 266 |
| 2005 | 227 | 404 | 271 | 354 | 564 | 403 | 520 | 809 | 818 | 778 | 244 | 208 |
| 2006 | 341 | 187 | 406 | 958 | 412 | 475 | 614 | 578 | 567 | 621 | 682 | 509 |
| 2007 | 276 | 395 | 385 | 486 | 427 | 429 | 832 | 360 | 330 | 566 | 483 | 328 |
| 2008 | 194 | 291 | 437 | 636 | 740 | 673 | 966 | 1,084 | 905 | 533 | 394 | 374 |
| 2009 | 426 | 288 | 317 | 391 | 300 | 783 | 594 | 409 | 416 | 269 | 295 | 321 |
| 2010 | 550 | 418 | 584 | 549 | 929 | 969 | 592 | 887 | 670 | 639 | 576 | 470 |
| 2011 | 402 | 448 | 655 | 477 | 408 | 587 | 624 | 661 | 641 | 561 | 425 | 292 |
| 2012 | 316 | 483 | 692 | 497 | 476 | 522 | 573 | 489 | 513 | 649 | 518 | 597 |
| 2013 | 617 | 660 | 813 | 534 | 469 | 462 | 636 | 664 | 583 | 370 | 615 | 639 |
| 2014 | 496 | 322 | 462 | 508 | 500 | 488 | 664 | 747 | 910 | 776 | 510 | 620 |
| 2015 | 165 | 381 | 602 | 373 | 609 | 677 | 632 | 538 | 382 | 499 | 312 | 145 |
| 2016 | 298 | 401 | 137 | 300 | 352 | 348 | 326 | 590 | 454 | 355 | 414 | 329 |
| 2017 | 484 | 329 | 424 | 165 | 455 | 371 | 566 | 523 | 552 | 530 | 129 | 382 |
| 2018 | 390 | 258 | 263 | 714 | 415 | 639 | 753 | 736 | 634 | 307 | 173 | 224 |
| 2019 | 335 | 356 | 345 | 429 | 407 | 495 | 473 | 393 | 172 | 879 | 582 | 474 |
| 2020 | 275 | 368 | 214 | 356 | 326 | 378 | 406 | 488 | 476 | 392 | 374 | 302 |
| 2021 | 405 | 249 | 359 | 320 | 248 | 302 | 267 | 321 | 337 | 230 | 210 | 268 |
| 2022 | -- | -- | -- | -- | -- | -- | -- | -- | -- | -- | -- | -- |
| 2023 | -- | -- | -- | -- | -- | -- | -- | -- | -- | -- | -- | -- |
| 2024 | -- | |||||||||||
| - = No Data Reported; -- = Not Applicable; NA = Not Available; W = Withheld to avoid disclosure of individual company data. |
| Release Date: 3/29/2024 |
| Next Release Date: 4/30/2024 |