|
Download Data (XLS File) |
|
||||||||
|
||||||||
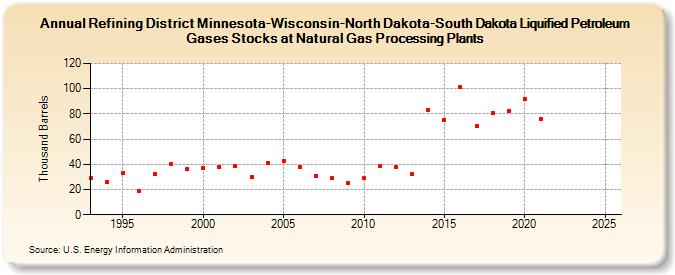
| Refining District Minnesota-Wisconsin-North Dakota-South Dakota Liquified Petroleum Gases Stocks at Natural Gas Processing Plants (Thousand Barrels) | ||||||||
| Decade | Year-0 | Year-1 | Year-2 | Year-3 | Year-4 | Year-5 | Year-6 | Year-7 | Year-8 | Year-9 |
|---|---|---|---|---|---|---|---|---|---|---|
| 1990's | 29 | 26 | 33 | 19 | 32 | 40 | 36 | |||
| 2000's | 37 | 38 | 39 | 30 | 41 | 43 | 38 | 31 | 29 | 25 |
| 2010's | 29 | 39 | 38 | 32 | 83 | 75 | 101 | 70 | 81 | 82 |
| 2020's | 92 | 76 | -- | -- |
| - = No Data Reported; -- = Not Applicable; NA = Not Available; W = Withheld to avoid disclosure of individual company data. |
| Release Date: 3/29/2024 |
| Next Release Date: 8/30/2024 |