|
Download Data (XLS File) |
|
||||||||
|
||||||||
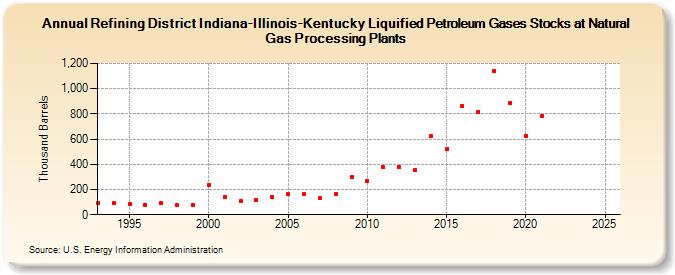
| Refining District Indiana-Illinois-Kentucky Liquified Petroleum Gases Stocks at Natural Gas Processing Plants (Thousand Barrels) | ||||||||
| Decade | Year-0 | Year-1 | Year-2 | Year-3 | Year-4 | Year-5 | Year-6 | Year-7 | Year-8 | Year-9 |
|---|---|---|---|---|---|---|---|---|---|---|
| 1990's | 89 | 91 | 82 | 81 | 89 | 76 | 78 | |||
| 2000's | 238 | 139 | 108 | 118 | 139 | 164 | 162 | 136 | 161 | 299 |
| 2010's | 271 | 375 | 378 | 351 | 621 | 524 | 859 | 817 | 1,140 | 888 |
| 2020's | 625 | 787 | -- | -- |
| - = No Data Reported; -- = Not Applicable; NA = Not Available; W = Withheld to avoid disclosure of individual company data. |
| Release Date: 3/29/2024 |
| Next Release Date: 8/30/2024 |