|
Download Data (XLS File) |
|
||||||||
|
||||||||
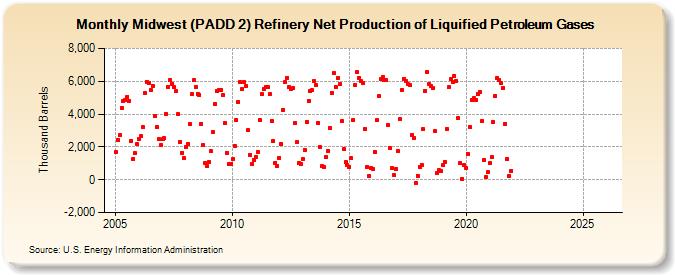
| Midwest (PADD 2) Refinery Net Production of Liquified Petroleum Gases (Thousand Barrels) | ||||||||
| Year | Jan | Feb | Mar | Apr | May | Jun | Jul | Aug | Sep | Oct | Nov | Dec |
|---|---|---|---|---|---|---|---|---|---|---|---|---|
| 2005 | 1,697 | 2,427 | 2,707 | 4,393 | 4,811 | 4,878 | 5,067 | 4,824 | 2,364 | 1,286 | 1,611 | 2,149 |
| 2006 | 2,511 | 2,638 | 3,195 | 5,291 | 5,975 | 5,901 | 5,476 | 5,730 | 3,905 | 3,223 | 2,460 | 2,104 |
| 2007 | 2,458 | 2,518 | 4,018 | 5,671 | 6,086 | 5,857 | 5,631 | 5,382 | 3,982 | 2,305 | 1,645 | 1,303 |
| 2008 | 1,998 | 2,202 | 3,393 | 5,218 | 6,059 | 5,667 | 5,247 | 5,174 | 3,404 | 2,113 | 998 | 848 |
| 2009 | 1,067 | 1,732 | 2,887 | 4,628 | 5,423 | 5,454 | 5,484 | 5,155 | 3,455 | 1,645 | 938 | 966 |
| 2010 | 1,247 | 2,072 | 3,624 | 4,748 | 5,936 | 5,506 | 5,953 | 5,700 | 3,020 | 1,534 | 979 | 1,228 |
| 2011 | 1,409 | 1,706 | 3,652 | 5,231 | 5,535 | 5,661 | 5,652 | 5,192 | 3,604 | 2,343 | 1,043 | 812 |
| 2012 | 1,333 | 2,189 | 4,249 | 5,941 | 6,214 | 5,654 | 5,542 | 5,558 | 3,455 | 2,285 | 1,036 | 961 |
| 2013 | 1,277 | 1,831 | 3,536 | 4,820 | 5,425 | 5,438 | 6,009 | 5,758 | 3,462 | 1,988 | 846 | 775 |
| 2014 | 1,377 | 1,778 | 3,175 | 5,304 | 6,500 | 5,669 | 6,209 | 5,804 | 3,567 | 1,869 | 1,076 | 874 |
| 2015 | 786 | 1,305 | 3,627 | 5,790 | 6,544 | 6,214 | 5,997 | 5,885 | 3,102 | 793 | 256 | 717 |
| 2016 | 679 | 1,693 | 3,635 | 5,086 | 6,115 | 6,251 | 6,099 | 6,054 | 3,348 | 1,926 | 724 | 300 |
| 2017 | 678 | 1,743 | 3,669 | 5,493 | 6,160 | 6,034 | 5,828 | 5,759 | 2,723 | 2,528 | -194 | 245 |
| 2018 | 763 | 912 | 3,073 | 5,430 | 6,549 | 5,816 | 5,683 | 5,582 | 2,963 | 415 | 577 | 515 |
| 2019 | 887 | 1,099 | 3,090 | 5,627 | 6,113 | 5,981 | 6,339 | 6,018 | 3,735 | 989 | 61 | 921 |
| 2020 | 725 | 1,555 | 3,199 | 4,879 | 4,956 | 4,871 | 5,221 | 5,335 | 3,575 | 1,216 | 181 | 453 |
| 2021 | 1,009 | 1,368 | 3,505 | 5,111 | 6,188 | 6,060 | 5,888 | 5,608 | 3,418 | 1,261 | 251 | 560 |
| 2022 | -- | -- | -- | -- | -- | -- | -- | -- | -- | -- | -- | -- |
| 2023 | -- | -- | -- | -- | -- | -- | -- | -- | -- | -- | -- | -- |
| 2024 | -- | |||||||||||
| - = No Data Reported; -- = Not Applicable; NA = Not Available; W = Withheld to avoid disclosure of individual company data. |
| Release Date: 3/29/2024 |
| Next Release Date: 4/30/2024 |