|
Download Data (XLS File) |
|
||||||||
|
||||||||
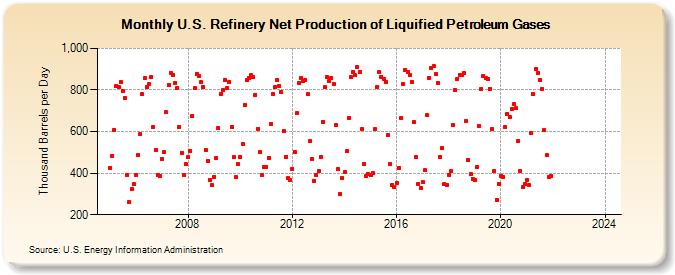
| U.S. Refinery Net Production of Liquified Petroleum Gases (Thousand Barrels per Day) | ||||||||
| Year | Jan | Feb | Mar | Apr | May | Jun | Jul | Aug | Sep | Oct | Nov | Dec |
|---|---|---|---|---|---|---|---|---|---|---|---|---|
| 2005 | 427 | 484 | 607 | 820 | 812 | 838 | 796 | 763 | 393 | 259 | 322 | 346 |
| 2006 | 393 | 487 | 587 | 779 | 856 | 814 | 829 | 860 | 622 | 511 | 393 | 387 |
| 2007 | 468 | 502 | 692 | 824 | 882 | 871 | 835 | 810 | 624 | 499 | 393 | 443 |
| 2008 | 478 | 507 | 676 | 809 | 878 | 867 | 837 | 814 | 513 | 460 | 369 | 341 |
| 2009 | 383 | 471 | 618 | 782 | 798 | 847 | 809 | 838 | 624 | 476 | 379 | 442 |
| 2010 | 480 | 540 | 726 | 850 | 857 | 870 | 860 | 778 | 614 | 501 | 390 | 430 |
| 2011 | 431 | 472 | 636 | 781 | 815 | 847 | 820 | 791 | 603 | 480 | 377 | 368 |
| 2012 | 421 | 503 | 688 | 835 | 858 | 841 | 848 | 779 | 553 | 470 | 364 | 390 |
| 2013 | 410 | 477 | 648 | 814 | 860 | 841 | 858 | 829 | 630 | 418 | 301 | 376 |
| 2014 | 406 | 505 | 666 | 860 | 887 | 870 | 909 | 888 | 610 | 444 | 387 | 398 |
| 2015 | 392 | 401 | 610 | 815 | 885 | 864 | 853 | 839 | 583 | 442 | 343 | 333 |
| 2016 | 354 | 426 | 666 | 829 | 897 | 888 | 873 | 838 | 645 | 476 | 349 | 330 |
| 2017 | 355 | 413 | 678 | 857 | 908 | 915 | 877 | 834 | 477 | 520 | 348 | 341 |
| 2018 | 393 | 409 | 632 | 800 | 855 | 874 | 870 | 880 | 650 | 464 | 395 | 373 |
| 2019 | 368 | 429 | 629 | 804 | 867 | 859 | 852 | 806 | 613 | 409 | 272 | 348 |
| 2020 | 388 | 381 | 621 | 683 | 671 | 710 | 732 | 712 | 555 | 410 | 333 | 347 |
| 2021 | 367 | 343 | 594 | 779 | 900 | 881 | 850 | 805 | 607 | 487 | 383 | 388 |
| 2022 | -- | -- | -- | -- | -- | -- | -- | -- | -- | -- | -- | -- |
| 2023 | -- | -- | -- | -- | -- | -- | -- | -- | -- | -- | -- | -- |
| 2024 | -- | |||||||||||
| - = No Data Reported; -- = Not Applicable; NA = Not Available; W = Withheld to avoid disclosure of individual company data. |
| Release Date: 3/29/2024 |
| Next Release Date: 4/30/2024 |