|
Download Data (XLS File) |
|
||||||||
|
||||||||
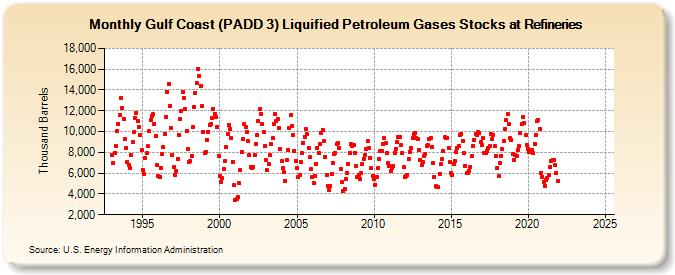
| Gulf Coast (PADD 3) Liquified Petroleum Gases Stocks at Refineries (Thousand Barrels) | ||||||||
| Year | Jan | Feb | Mar | Apr | May | Jun | Jul | Aug | Sep | Oct | Nov | Dec |
|---|---|---|---|---|---|---|---|---|---|---|---|---|
| 1993 | 7,739 | 6,982 | 7,960 | 8,657 | 10,084 | 10,744 | 11,557 | 13,250 | 12,268 | 11,246 | 9,302 | 8,426 |
| 1994 | 7,085 | 6,762 | 6,493 | 7,758 | 8,965 | 9,922 | 11,345 | 11,799 | 10,998 | 10,459 | 9,665 | 8,243 |
| 1995 | 6,326 | 5,905 | 7,450 | 7,901 | 8,576 | 10,028 | 11,068 | 11,505 | 11,652 | 10,774 | 9,558 | 6,757 |
| 1996 | 5,694 | 5,641 | 6,481 | 7,821 | 8,479 | 9,728 | 11,409 | 13,808 | 14,602 | 12,505 | 10,308 | 7,711 |
| 1997 | 6,561 | 5,859 | 6,186 | 7,357 | 9,694 | 11,170 | 11,972 | 13,767 | 13,256 | 12,144 | 10,068 | 8,281 |
| 1998 | 7,089 | 7,124 | 7,685 | 10,403 | 12,372 | 13,731 | 14,632 | 16,045 | 15,368 | 14,368 | 12,490 | 9,914 |
| 1999 | 7,970 | 8,035 | 9,199 | 10,002 | 10,622 | 10,763 | 11,280 | 12,170 | 11,670 | 11,423 | 10,450 | 7,696 |
| 2000 | 5,715 | 5,186 | 5,498 | 6,400 | 7,140 | 8,499 | 9,738 | 10,634 | 10,205 | 9,334 | 7,119 | 4,850 |
| 2001 | 3,413 | 3,466 | 3,674 | 5,006 | 6,312 | 8,017 | 9,255 | 10,685 | 10,444 | 9,953 | 9,087 | 7,728 |
| 2002 | 6,561 | 6,464 | 6,608 | 7,729 | 8,814 | 9,690 | 10,991 | 12,124 | 11,706 | 10,710 | 9,933 | 8,569 |
| 2003 | 7,283 | 6,264 | 6,904 | 7,738 | 8,775 | 9,340 | 10,766 | 11,679 | 11,032 | 11,216 | 10,345 | 8,283 |
| 2004 | 7,156 | 6,449 | 6,076 | 5,217 | 7,261 | 8,237 | 10,346 | 11,597 | 10,554 | 9,626 | 8,125 | 7,184 |
| 2005 | 6,455 | 5,597 | 5,779 | 7,066 | 7,903 | 8,933 | 9,516 | 10,217 | 9,723 | 8,440 | 7,515 | 6,353 |
| 2006 | 5,585 | 5,065 | 5,680 | 6,872 | 8,448 | 7,959 | 8,791 | 9,874 | 10,168 | 9,060 | 7,525 | 5,793 |
| 2007 | 4,797 | 4,367 | 4,739 | 5,914 | 6,991 | 7,885 | 7,930 | 8,775 | 8,877 | 8,395 | 6,427 | 5,099 |
| 2008 | 4,240 | 4,467 | 5,427 | 5,992 | 6,902 | 7,984 | 8,801 | 8,650 | 8,743 | 7,970 | 6,692 | 5,612 |
| 2009 | 5,833 | 5,481 | 5,988 | 6,863 | 7,365 | 7,756 | 8,287 | 9,046 | 8,462 | 7,480 | 6,505 | 5,764 |
| 2010 | 5,403 | 4,885 | 5,638 | 6,486 | 7,337 | 8,084 | 8,157 | 8,819 | 9,372 | 8,855 | 7,954 | 7,006 |
| 2011 | 6,693 | 6,186 | 6,465 | 6,701 | 7,972 | 8,364 | 9,043 | 9,476 | 9,507 | 8,668 | 7,943 | 6,575 |
| 2012 | 5,656 | 5,709 | 5,862 | 7,315 | 8,028 | 8,370 | 9,363 | 9,793 | 9,895 | 9,423 | 9,275 | 8,215 |
| 2013 | 7,308 | 6,797 | 7,088 | 7,632 | 7,865 | 8,655 | 8,680 | 9,301 | 9,361 | 8,475 | 7,009 | 5,629 |
| 2014 | 4,737 | 4,712 | 4,710 | 5,934 | 6,845 | 7,320 | 8,166 | 9,477 | 9,421 | 9,399 | 8,455 | 7,041 |
| 2015 | 6,051 | 5,784 | 6,913 | 7,200 | 8,039 | 8,393 | 8,656 | 9,656 | 9,801 | 9,097 | 7,913 | 6,732 |
| 2016 | 6,014 | 6,038 | 6,210 | 6,609 | 7,622 | 8,611 | 9,205 | 9,757 | 9,628 | 9,943 | 9,814 | 8,955 |
| 2017 | 8,676 | 9,376 | 7,954 | 7,922 | 8,151 | 8,421 | 8,578 | 9,772 | 9,252 | 9,674 | 8,597 | 7,687 |
| 2018 | 6,533 | 5,693 | 6,964 | 7,679 | 8,279 | 9,091 | 10,250 | 11,090 | 11,684 | 10,684 | 9,373 | 9,190 |
| 2019 | 7,850 | 7,296 | 7,737 | 7,666 | 8,270 | 8,655 | 9,820 | 10,728 | 11,406 | 10,786 | 9,638 | 8,725 |
| 2020 | 8,353 | 8,024 | 8,054 | 8,201 | 7,893 | 8,845 | 9,681 | 11,002 | 11,123 | 10,244 | 6,052 | 5,675 |
| 2021 | 5,180 | 4,772 | 5,314 | 5,571 | 5,776 | 6,608 | 7,189 | 7,307 | 7,284 | 6,770 | 6,030 | 5,220 |
| 2022 | -- | -- | -- | -- | -- | -- | -- | -- | -- | -- | -- | -- |
| 2023 | -- | -- | -- | -- | -- | -- | -- | -- | -- | -- | -- | -- |
| 2024 | -- | |||||||||||
| - = No Data Reported; -- = Not Applicable; NA = Not Available; W = Withheld to avoid disclosure of individual company data. |
| Release Date: 3/29/2024 |
| Next Release Date: 4/30/2024 |