|
Download Data (XLS File) |
|
||||||||
|
||||||||
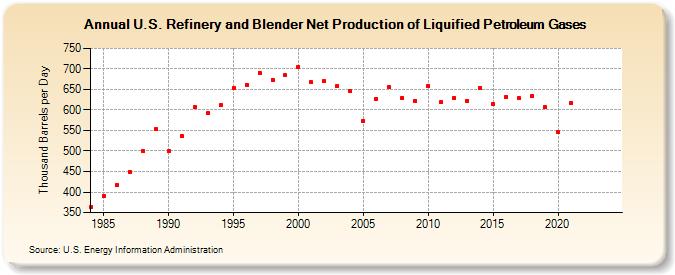
| U.S. Refinery and Blender Net Production of Liquified Petroleum Gases (Thousand Barrels per Day) | ||||||||
| Decade | Year-0 | Year-1 | Year-2 | Year-3 | Year-4 | Year-5 | Year-6 | Year-7 | Year-8 | Year-9 |
|---|---|---|---|---|---|---|---|---|---|---|
| 1980's | 363 | 391 | 417 | 449 | 499 | 554 | ||||
| 1990's | 499 | 536 | 607 | 592 | 611 | 654 | 662 | 691 | 674 | 684 |
| 2000's | 705 | 667 | 671 | 658 | 645 | 573 | 627 | 655 | 630 | 623 |
| 2010's | 659 | 619 | 630 | 623 | 653 | 615 | 632 | 628 | 634 | 606 |
| 2020's | 546 | 617 | -- | -- |
| - = No Data Reported; -- = Not Applicable; NA = Not Available; W = Withheld to avoid disclosure of individual company data. |
| Release Date: 3/29/2024 |
| Next Release Date: 8/30/2024 |