|
Download Data (XLS File) |
|
||||||||
|
||||||||
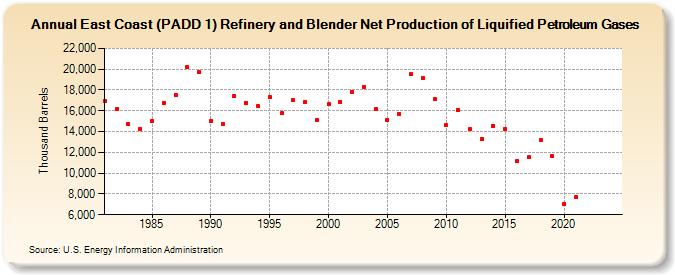
| East Coast (PADD 1) Refinery and Blender Net Production of Liquified Petroleum Gases (Thousand Barrels) | ||||||||
| Decade | Year-0 | Year-1 | Year-2 | Year-3 | Year-4 | Year-5 | Year-6 | Year-7 | Year-8 | Year-9 |
|---|---|---|---|---|---|---|---|---|---|---|
| 1980's | 16,987 | 16,164 | 14,679 | 14,253 | 14,979 | 16,709 | 17,539 | 20,181 | 19,705 | |
| 1990's | 15,018 | 14,719 | 17,417 | 16,754 | 16,418 | 17,330 | 15,761 | 16,993 | 16,836 | 15,092 |
| 2000's | 16,619 | 16,871 | 17,791 | 18,248 | 16,131 | 15,123 | 15,691 | 19,492 | 19,167 | 17,148 |
| 2010's | 14,586 | 16,053 | 14,202 | 13,291 | 14,556 | 14,223 | 11,148 | 11,508 | 13,158 | 11,607 |
| 2020's | 7,056 | 7,698 | -- | -- |
| - = No Data Reported; -- = Not Applicable; NA = Not Available; W = Withheld to avoid disclosure of individual company data. |
| Release Date: 3/29/2024 |
| Next Release Date: 8/30/2024 |