|
Download Data (XLS File) |
|
||||||||
|
||||||||
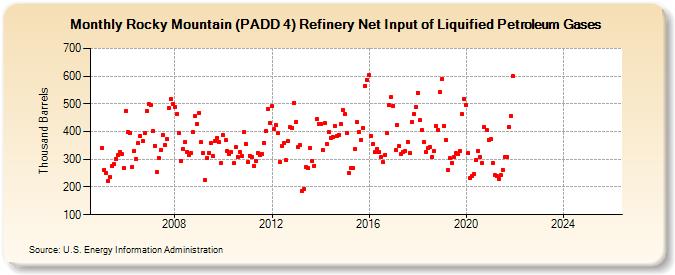
| Rocky Mountain (PADD 4) Refinery Net Input of Liquified Petroleum Gases (Thousand Barrels) | ||||||||
| Year | Jan | Feb | Mar | Apr | May | Jun | Jul | Aug | Sep | Oct | Nov | Dec |
|---|---|---|---|---|---|---|---|---|---|---|---|---|
| 2005 | 342 | 263 | 252 | 223 | 236 | 275 | 282 | 302 | 317 | 326 | 319 | 268 |
| 2006 | 475 | 397 | 394 | 273 | 331 | 301 | 359 | 385 | 365 | 394 | 473 | 500 |
| 2007 | 497 | 401 | 349 | 253 | 306 | 334 | 388 | 352 | 374 | 484 | 516 | 499 |
| 2008 | 490 | 463 | 395 | 293 | 336 | 363 | 327 | 315 | 323 | 398 | 455 | 427 |
| 2009 | 468 | 361 | 323 | 227 | 306 | 324 | 357 | 311 | 366 | 378 | 362 | 288 |
| 2010 | 386 | 369 | 329 | 320 | 327 | 286 | 343 | 310 | 326 | 312 | 397 | 356 |
| 2011 | 289 | 313 | 307 | 276 | 294 | 323 | 315 | 320 | 359 | 402 | 483 | 431 |
| 2012 | 491 | 408 | 423 | 395 | 291 | 348 | 359 | 296 | 366 | 415 | 414 | 504 |
| 2013 | 436 | 345 | 351 | 186 | 194 | 271 | 268 | 341 | 293 | 277 | 444 | 427 |
| 2014 | 426 | 334 | 430 | 355 | 399 | 378 | 380 | 421 | 383 | 389 | 428 | 478 |
| 2015 | 462 | 394 | 251 | 268 | 270 | 337 | 433 | 400 | 370 | 414 | 566 | 586 |
| 2016 | 603 | 385 | 355 | 325 | 338 | 325 | 309 | 289 | 317 | 393 | 494 | 524 |
| 2017 | 493 | 334 | 425 | 347 | 320 | 326 | 330 | 364 | 323 | 434 | 465 | 487 |
| 2018 | 540 | 440 | 407 | 361 | 326 | 339 | 344 | 309 | 329 | 421 | 406 | 542 |
| 2019 | 588 | 420 | 370 | 263 | 303 | 288 | 308 | 321 | 320 | 330 | 464 | 519 |
| 2020 | 494 | 321 | 232 | 240 | 247 | 298 | 330 | 309 | 287 | 417 | 406 | 370 |
| 2021 | 372 | 288 | 242 | 239 | 230 | 242 | 263 | 308 | 310 | 417 | 456 | 599 |
| 2022 | -- | -- | -- | -- | -- | -- | -- | -- | -- | -- | -- | -- |
| 2023 | -- | -- | -- | -- | -- | -- | -- | -- | -- | -- | -- | -- |
| 2024 | -- | -- | -- | -- | ||||||||
| - = No Data Reported; -- = Not Applicable; NA = Not Available; W = Withheld to avoid disclosure of individual company data. |
| Release Date: 6/28/2024 |
| Next Release Date: 7/31/2024 |
Referring Pages: