|
Download Data (XLS File) |


|
||||||||
|
||||||||
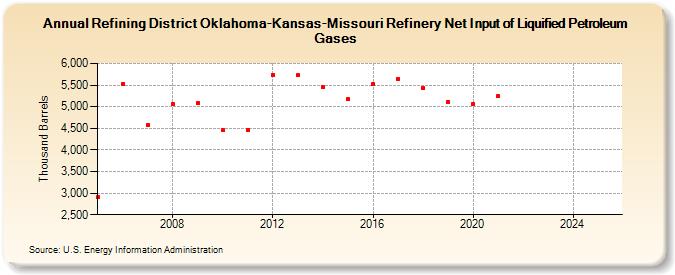
| Refining District Oklahoma-Kansas-Missouri Refinery Net Input of Liquified Petroleum Gases (Thousand Barrels) | ||||||||
| Decade | Year-0 | Year-1 | Year-2 | Year-3 | Year-4 | Year-5 | Year-6 | Year-7 | Year-8 | Year-9 |
|---|---|---|---|---|---|---|---|---|---|---|
| 2000's | 2,903 | 5,527 | 4,574 | 5,054 | 5,081 | |||||
| 2010's | 4,458 | 4,465 | 5,744 | 5,722 | 5,452 | 5,177 | 5,514 | 5,647 | 5,430 | 5,110 |
| 2020's | 5,066 | 5,244 | -- | -- |
| - = No Data Reported; -- = Not Applicable; NA = Not Available; W = Withheld to avoid disclosure of individual company data. |
| Release Date: 3/29/2024 |
| Next Release Date: 8/30/2024 |