|
Download Data (XLS File) |
|
||||||||
|
||||||||
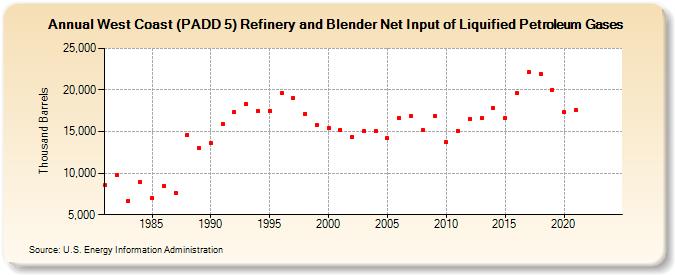
| West Coast (PADD 5) Refinery and Blender Net Input of Liquified Petroleum Gases (Thousand Barrels) | ||||||||
| Decade | Year-0 | Year-1 | Year-2 | Year-3 | Year-4 | Year-5 | Year-6 | Year-7 | Year-8 | Year-9 |
|---|---|---|---|---|---|---|---|---|---|---|
| 1980's | 8,524 | 9,770 | 6,697 | 8,979 | 7,009 | 8,502 | 7,645 | 14,596 | 13,018 | |
| 1990's | 13,591 | 15,884 | 17,378 | 18,324 | 17,496 | 17,528 | 19,622 | 19,055 | 17,148 | 15,808 |
| 2000's | 15,446 | 15,195 | 14,402 | 15,017 | 15,051 | 14,218 | 16,659 | 16,825 | 15,157 | 16,922 |
| 2010's | 13,697 | 15,124 | 16,543 | 16,632 | 17,862 | 16,667 | 19,581 | 22,149 | 21,893 | 20,056 |
| 2020's | 17,297 | 17,582 | -- | -- |
| - = No Data Reported; -- = Not Applicable; NA = Not Available; W = Withheld to avoid disclosure of individual company data. |
| Release Date: 6/28/2024 |
| Next Release Date: 8/30/2024 |