|
Download Data (XLS File) |
|
||||||||
|
||||||||
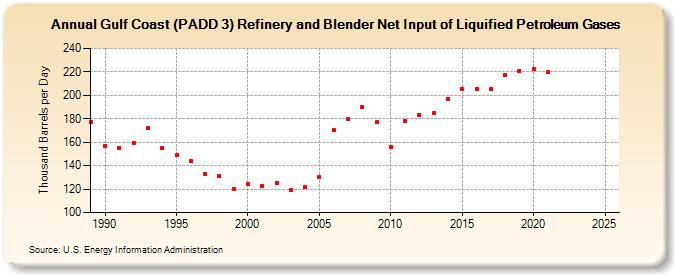
| Gulf Coast (PADD 3) Refinery and Blender Net Input of Liquified Petroleum Gases (Thousand Barrels per Day) | ||||||||
| Decade | Year-0 | Year-1 | Year-2 | Year-3 | Year-4 | Year-5 | Year-6 | Year-7 | Year-8 | Year-9 |
|---|---|---|---|---|---|---|---|---|---|---|
| 1980's | 177 | |||||||||
| 1990's | 157 | 155 | 159 | 172 | 155 | 149 | 144 | 133 | 131 | 120 |
| 2000's | 124 | 123 | 125 | 119 | 122 | 130 | 170 | 180 | 190 | 177 |
| 2010's | 156 | 178 | 183 | 185 | 197 | 205 | 205 | 205 | 217 | 221 |
| 2020's | 222 | 220 | -- | -- |
| - = No Data Reported; -- = Not Applicable; NA = Not Available; W = Withheld to avoid disclosure of individual company data. |
| Release Date: 3/29/2024 |
| Next Release Date: 8/30/2024 |