|
Download Data (XLS File) |
|
||||||||
|
||||||||
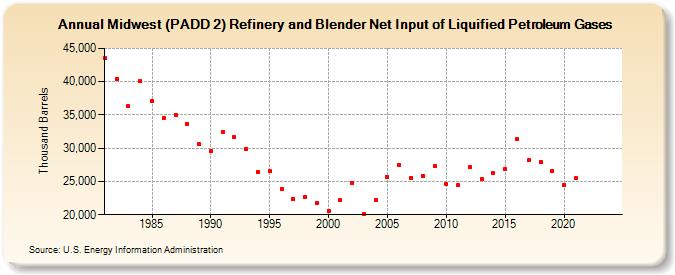
| Midwest (PADD 2) Refinery and Blender Net Input of Liquified Petroleum Gases (Thousand Barrels) | ||||||||
| Decade | Year-0 | Year-1 | Year-2 | Year-3 | Year-4 | Year-5 | Year-6 | Year-7 | Year-8 | Year-9 |
|---|---|---|---|---|---|---|---|---|---|---|
| 1980's | 43,483 | 40,363 | 36,291 | 40,102 | 37,037 | 34,590 | 35,011 | 33,699 | 30,569 | |
| 1990's | 29,610 | 32,438 | 31,647 | 29,889 | 26,458 | 26,514 | 23,902 | 22,382 | 22,611 | 21,776 |
| 2000's | 20,575 | 22,175 | 24,836 | 20,054 | 22,161 | 25,650 | 27,412 | 25,570 | 25,877 | 27,263 |
| 2010's | 24,642 | 24,446 | 27,157 | 25,297 | 26,205 | 26,813 | 31,318 | 28,167 | 27,971 | 26,636 |
| 2020's | 24,489 | 25,485 | -- | -- |
| - = No Data Reported; -- = Not Applicable; NA = Not Available; W = Withheld to avoid disclosure of individual company data. |
| Release Date: 3/29/2024 |
| Next Release Date: 8/30/2024 |