|
Download Data (XLS File) |
|
||||||||
|
||||||||
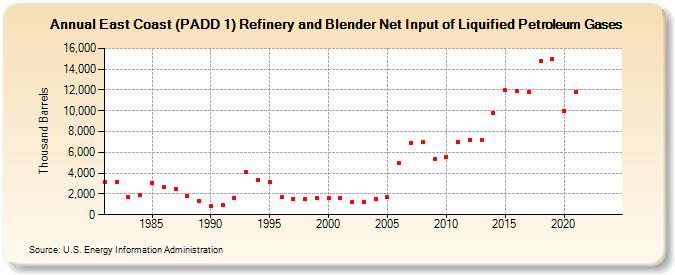
| East Coast (PADD 1) Refinery and Blender Net Input of Liquified Petroleum Gases (Thousand Barrels) | ||||||||
| Decade | Year-0 | Year-1 | Year-2 | Year-3 | Year-4 | Year-5 | Year-6 | Year-7 | Year-8 | Year-9 |
|---|---|---|---|---|---|---|---|---|---|---|
| 1980's | 3,141 | 3,175 | 1,688 | 1,897 | 3,088 | 2,634 | 2,451 | 1,835 | 1,317 | |
| 1990's | 875 | 895 | 1,573 | 4,067 | 3,327 | 3,173 | 1,667 | 1,519 | 1,512 | 1,572 |
| 2000's | 1,579 | 1,590 | 1,241 | 1,217 | 1,466 | 1,693 | 4,938 | 6,929 | 6,998 | 5,362 |
| 2010's | 5,592 | 6,995 | 7,201 | 7,156 | 9,816 | 11,975 | 11,864 | 11,825 | 14,812 | 14,960 |
| 2020's | 9,993 | 11,828 | -- | -- |
| - = No Data Reported; -- = Not Applicable; NA = Not Available; W = Withheld to avoid disclosure of individual company data. |
| Release Date: 3/29/2024 |
| Next Release Date: 8/30/2024 |