|
Download Data (XLS File) |
|
||||||||
|
||||||||
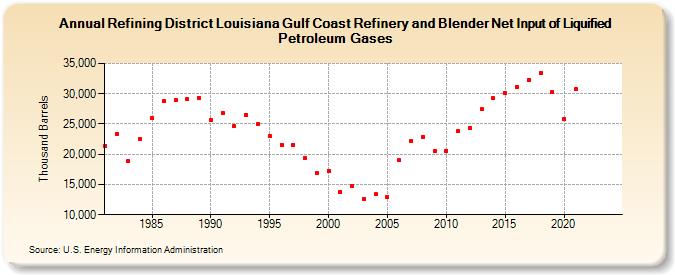
| Refining District Louisiana Gulf Coast Refinery and Blender Net Input of Liquified Petroleum Gases (Thousand Barrels) | ||||||||
| Decade | Year-0 | Year-1 | Year-2 | Year-3 | Year-4 | Year-5 | Year-6 | Year-7 | Year-8 | Year-9 |
|---|---|---|---|---|---|---|---|---|---|---|
| 1980's | 21,369 | 23,356 | 18,914 | 22,574 | 25,957 | 28,757 | 28,908 | 29,117 | 29,367 | |
| 1990's | 25,584 | 26,883 | 24,595 | 26,516 | 25,026 | 22,946 | 21,598 | 21,571 | 19,419 | 16,877 |
| 2000's | 17,292 | 13,743 | 14,790 | 12,617 | 13,357 | 12,858 | 19,038 | 22,153 | 22,899 | 20,479 |
| 2010's | 20,590 | 23,833 | 24,362 | 27,433 | 29,218 | 30,095 | 31,157 | 32,322 | 33,403 | 30,343 |
| 2020's | 25,742 | 30,730 | -- | -- |
| - = No Data Reported; -- = Not Applicable; NA = Not Available; W = Withheld to avoid disclosure of individual company data. |
| Release Date: 6/28/2024 |
| Next Release Date: 8/30/2024 |