|
Download Data (XLS File) |
|
||||||||
|
||||||||
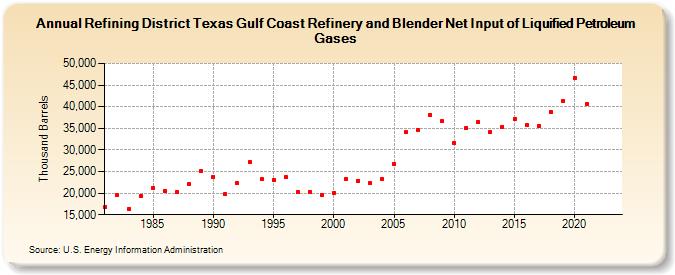
| Refining District Texas Gulf Coast Refinery and Blender Net Input of Liquified Petroleum Gases (Thousand Barrels) | ||||||||
| Decade | Year-0 | Year-1 | Year-2 | Year-3 | Year-4 | Year-5 | Year-6 | Year-7 | Year-8 | Year-9 |
|---|---|---|---|---|---|---|---|---|---|---|
| 1980's | 16,762 | 19,505 | 16,396 | 19,377 | 21,262 | 20,491 | 20,214 | 22,077 | 25,159 | |
| 1990's | 23,760 | 19,692 | 22,267 | 27,170 | 23,210 | 22,995 | 23,755 | 20,272 | 20,322 | 19,553 |
| 2000's | 20,097 | 23,304 | 22,877 | 22,329 | 23,316 | 26,752 | 34,186 | 34,718 | 38,186 | 36,630 |
| 2010's | 31,555 | 35,175 | 36,471 | 34,149 | 35,388 | 37,169 | 35,679 | 35,646 | 38,790 | 41,343 |
| 2020's | 46,717 | 40,694 | -- | -- | -- |
| - = No Data Reported; -- = Not Applicable; NA = Not Available; W = Withheld to avoid disclosure of individual company data. |
| Release Date: 6/30/2025 |
| Next Release Date: 8/29/2025 |