|
Download Data (XLS File) |
|
||||||||
|
||||||||
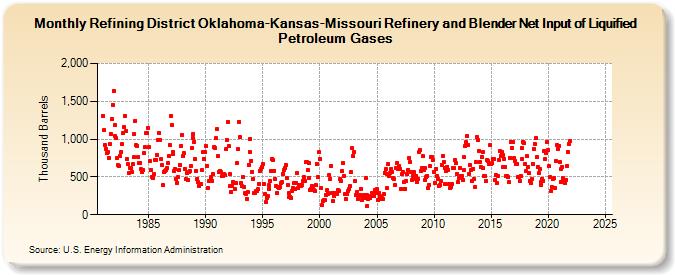
| Refining District Oklahoma-Kansas-Missouri Refinery and Blender Net Input of Liquified Petroleum Gases (Thousand Barrels) | ||||||||
| Year | Jan | Feb | Mar | Apr | May | Jun | Jul | Aug | Sep | Oct | Nov | Dec |
|---|---|---|---|---|---|---|---|---|---|---|---|---|
| 1981 | 1,308 | 1,123 | 924 | 870 | 819 | 823 | 751 | 935 | 1,071 | 1,268 | 1,456 | 1,637 |
| 1982 | 1,187 | 1,037 | 1,011 | 753 | 654 | 648 | 771 | 825 | 930 | 1,078 | 1,154 | 1,307 |
| 1983 | 1,105 | 739 | 667 | 546 | 622 | 620 | 568 | 666 | 758 | 1,065 | 1,244 | 918 |
| 1984 | 913 | 758 | 678 | 689 | 599 | 565 | 592 | 816 | 892 | 1,075 | 1,077 | 1,147 |
| 1985 | 892 | 707 | 590 | 503 | 484 | 483 | 535 | 717 | 730 | 788 | 982 | 1,075 |
| 1986 | 988 | 740 | 653 | 389 | 570 | 578 | 590 | 619 | 682 | 776 | 927 | 1,308 |
| 1987 | 1,183 | 797 | 829 | 573 | 609 | 475 | 425 | 496 | 594 | 661 | 915 | 1,060 |
| 1988 | 771 | 810 | 605 | 466 | 550 | 459 | 559 | 581 | 646 | 888 | 1,017 | 1,067 |
| 1989 | 965 | 737 | 580 | 478 | 430 | 380 | 400 | 408 | 587 | 826 | 740 | 824 |
| 1990 | 913 | 649 | 359 | 444 | 444 | 467 | 503 | 451 | 537 | 898 | 880 | 1,009 |
| 1991 | 1,129 | 770 | 562 | 572 | 560 | 506 | 512 | 538 | 519 | 863 | 992 | 1,223 |
| 1992 | 907 | 534 | 384 | 302 | 380 | 437 | 426 | 337 | 424 | 685 | 865 | 1,231 |
| 1993 | 1,022 | 422 | 378 | 502 | 367 | 283 | 271 | 212 | 297 | 663 | 833 | 1,004 |
| 1994 | 714 | 570 | 473 | 285 | 288 | 320 | 312 | 338 | 407 | 576 | 603 | 626 |
| 1995 | 666 | 400 | 268 | 168 | 226 | 253 | 387 | 342 | 446 | 576 | 743 | 723 |
| 1996 | 584 | 467 | 379 | 288 | 368 | 354 | 371 | 415 | 432 | 539 | 589 | 620 |
| 1997 | 653 | 490 | 390 | 286 | 239 | 233 | 225 | 317 | 354 | 423 | 339 | 421 |
| 1998 | 554 | 353 | 396 | 393 | 383 | 391 | 441 | 498 | 447 | 691 | 698 | 591 |
| 1999 | 678 | 488 | 333 | 345 | 383 | 346 | 326 | 309 | 387 | 677 | 499 | 825 |
| 2000 | 738 | 353 | 124 | 182 | 190 | 189 | 263 | 323 | 276 | 288 | 525 | 473 |
| 2001 | 642 | 289 | 181 | 253 | 291 | 274 | 279 | 327 | 319 | 466 | 446 | 573 |
| 2002 | 688 | 515 | 269 | 208 | 276 | 273 | 314 | 344 | 379 | 559 | 876 | 775 |
| 2003 | 830 | 452 | 260 | 298 | 211 | 246 | 262 | 343 | 194 | 216 | 262 | 218 |
| 2004 | 486 | 261 | 112 | 205 | 225 | 217 | 243 | 285 | 253 | 251 | 321 | 290 |
| 2005 | 334 | 201 | 290 | 247 | 214 | 225 | 213 | 272 | 557 | 603 | 348 | 545 |
| 2006 | 668 | 510 | 558 | 609 | 570 | 491 | 474 | 397 | 618 | 687 | 607 | 650 |
| 2007 | 609 | 339 | 534 | 569 | 431 | 337 | 344 | 447 | 534 | 596 | 749 | 691 |
| 2008 | 562 | 463 | 512 | 559 | 469 | 512 | 427 | 472 | 826 | 850 | 578 | 615 |
| 2009 | 773 | 596 | 619 | 460 | 496 | 516 | 350 | 393 | 642 | 766 | 767 | 718 |
| 2010 | 567 | 425 | 610 | 512 | 473 | 384 | 390 | 442 | 664 | 774 | 697 | 619 |
| 2011 | 404 | 575 | 637 | 593 | 402 | 355 | 368 | 405 | 615 | 620 | 721 | 678 |
| 2012 | 540 | 429 | 482 | 623 | 518 | 506 | 465 | 591 | 757 | 905 | 957 | 1,045 |
| 2013 | 922 | 544 | 658 | 586 | 450 | 611 | 469 | 372 | 692 | 1,022 | 983 | 843 |
| 2014 | 699 | 634 | 768 | 824 | 612 | 507 | 506 | 450 | 724 | 715 | 677 | 917 |
| 2015 | 666 | 680 | 739 | 739 | 462 | 526 | 416 | 510 | 722 | 837 | 774 | 825 |
| 2016 | 793 | 625 | 741 | 631 | 516 | 509 | 498 | 427 | 756 | 960 | 886 | 962 |
| 2017 | 753 | 714 | 670 | 676 | 502 | 500 | 443 | 517 | 880 | 743 | 963 | 945 |
| 2018 | 672 | 573 | 771 | 635 | 547 | 446 | 417 | 468 | 672 | 872 | 938 | 1,012 |
| 2019 | 760 | 635 | 546 | 609 | 430 | 388 | 471 | 446 | 844 | 738 | 816 | 960 |
| 2020 | 855 | 638 | 501 | 311 | 366 | 471 | 482 | 358 | 708 | 920 | 873 | 911 |
| 2021 | 694 | 431 | 600 | 628 | 481 | 464 | 420 | 461 | 646 | 831 | 941 | 973 |
| 2022 | -- | -- | -- | -- | -- | -- | -- | -- | -- | -- | -- | -- |
| 2023 | -- | -- | -- | -- | -- | -- | -- | -- | -- | -- | -- | -- |
| 2024 | -- | |||||||||||
| - = No Data Reported; -- = Not Applicable; NA = Not Available; W = Withheld to avoid disclosure of individual company data. |
| Release Date: 3/29/2024 |
| Next Release Date: 4/30/2024 |