|
Download Data (XLS File) |
|
||||||||
|
||||||||
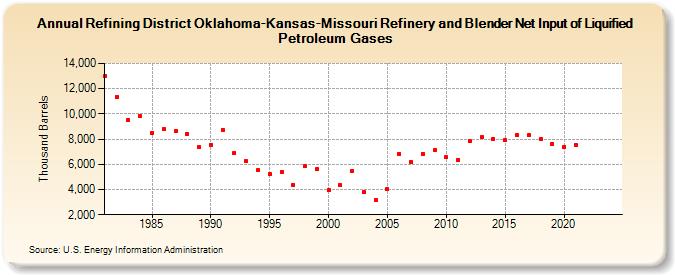
| Refining District Oklahoma-Kansas-Missouri Refinery and Blender Net Input of Liquified Petroleum Gases (Thousand Barrels) | ||||||||
| Decade | Year-0 | Year-1 | Year-2 | Year-3 | Year-4 | Year-5 | Year-6 | Year-7 | Year-8 | Year-9 |
|---|---|---|---|---|---|---|---|---|---|---|
| 1980's | 12,985 | 11,355 | 9,518 | 9,801 | 8,486 | 8,820 | 8,617 | 8,419 | 7,355 | |
| 1990's | 7,554 | 8,746 | 6,912 | 6,254 | 5,512 | 5,198 | 5,406 | 4,370 | 5,836 | 5,596 |
| 2000's | 3,924 | 4,340 | 5,476 | 3,792 | 3,149 | 4,049 | 6,839 | 6,180 | 6,845 | 7,096 |
| 2010's | 6,557 | 6,373 | 7,818 | 8,152 | 8,033 | 7,896 | 8,304 | 8,306 | 8,023 | 7,643 |
| 2020's | 7,394 | 7,570 | -- | -- |
| - = No Data Reported; -- = Not Applicable; NA = Not Available; W = Withheld to avoid disclosure of individual company data. |
| Release Date: 6/28/2024 |
| Next Release Date: 8/30/2024 |