|
Download Data (XLS File) |
|
||||||||
|
||||||||
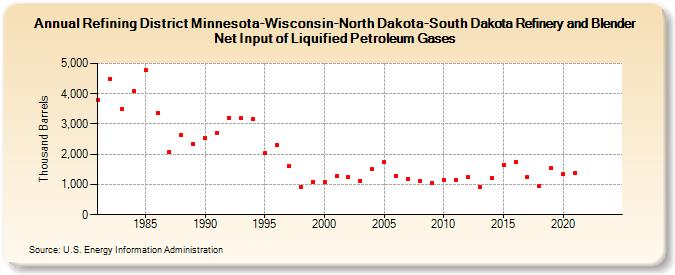
| Refining District Minnesota-Wisconsin-North Dakota-South Dakota Refinery and Blender Net Input of Liquified Petroleum Gases (Thousand Barrels) | ||||||||
| Decade | Year-0 | Year-1 | Year-2 | Year-3 | Year-4 | Year-5 | Year-6 | Year-7 | Year-8 | Year-9 |
|---|---|---|---|---|---|---|---|---|---|---|
| 1980's | 3,806 | 4,499 | 3,489 | 4,084 | 4,786 | 3,378 | 2,088 | 2,627 | 2,341 | |
| 1990's | 2,549 | 2,703 | 3,198 | 3,186 | 3,172 | 2,024 | 2,295 | 1,604 | 924 | 1,085 |
| 2000's | 1,069 | 1,272 | 1,238 | 1,126 | 1,502 | 1,740 | 1,296 | 1,189 | 1,122 | 1,035 |
| 2010's | 1,149 | 1,143 | 1,255 | 927 | 1,223 | 1,658 | 1,747 | 1,240 | 964 | 1,541 |
| 2020's | 1,339 | 1,371 | -- | -- |
| - = No Data Reported; -- = Not Applicable; NA = Not Available; W = Withheld to avoid disclosure of individual company data. |
| Release Date: 6/28/2024 |
| Next Release Date: 8/30/2024 |