|
Download Data (XLS File) |
|
||||||||
|
||||||||
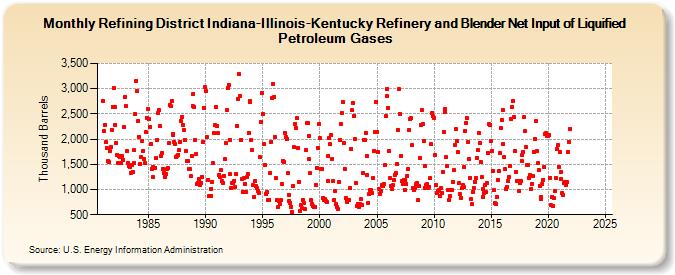
| Refining District Indiana-Illinois-Kentucky Refinery and Blender Net Input of Liquified Petroleum Gases (Thousand Barrels) | ||||||||
| Year | Jan | Feb | Mar | Apr | May | Jun | Jul | Aug | Sep | Oct | Nov | Dec |
|---|---|---|---|---|---|---|---|---|---|---|---|---|
| 1981 | 2,754 | 2,163 | 2,285 | 1,942 | 1,833 | 1,558 | 1,541 | 1,757 | 1,840 | 2,189 | 2,642 | 3,023 |
| 1982 | 2,636 | 2,282 | 1,923 | 1,676 | 1,520 | 1,668 | 1,639 | 1,524 | 1,661 | 1,582 | 2,236 | 2,843 |
| 1983 | 2,654 | 1,757 | 1,516 | 1,465 | 1,442 | 1,334 | 1,483 | 1,351 | 1,517 | 1,779 | 2,495 | 3,160 |
| 1984 | 2,950 | 2,367 | 2,048 | 1,515 | 1,639 | 1,963 | 1,767 | 1,612 | 1,519 | 2,137 | 2,424 | 2,598 |
| 1985 | 2,392 | 2,244 | 1,899 | 1,408 | 1,250 | 1,445 | 1,427 | 1,432 | 1,618 | 1,983 | 2,515 | 2,572 |
| 1986 | 2,253 | 1,666 | 1,721 | 1,411 | 1,332 | 1,258 | 1,303 | 1,402 | 1,424 | 1,916 | 2,685 | 2,648 |
| 1987 | 2,752 | 2,084 | 2,107 | 1,934 | 1,898 | 1,643 | 1,671 | 1,691 | 1,783 | 1,938 | 2,357 | 2,448 |
| 1988 | 2,282 | 2,182 | 1,984 | 1,771 | 1,557 | 1,570 | 1,406 | 1,402 | 1,267 | 1,673 | 2,658 | 2,901 |
| 1989 | 2,631 | 1,989 | 1,712 | 1,112 | 1,128 | 1,212 | 1,094 | 1,135 | 1,257 | 1,951 | 2,623 | 3,029 |
| 1990 | 2,952 | 2,040 | 1,194 | 864 | 862 | 879 | 1,020 | 1,156 | 1,517 | 2,121 | 2,275 | 2,627 |
| 1991 | 2,262 | 2,113 | 1,290 | 1,241 | 1,380 | 1,172 | 1,139 | 1,275 | 1,605 | 1,920 | 2,569 | 3,023 |
| 1992 | 3,081 | 1,985 | 1,300 | 1,035 | 1,133 | 1,126 | 1,176 | 1,048 | 1,305 | 2,258 | 2,801 | 3,289 |
| 1993 | 2,858 | 1,990 | 1,216 | 948 | 1,220 | 1,119 | 953 | 1,240 | 1,299 | 2,129 | 2,748 | 2,729 |
| 1994 | 1,986 | 1,780 | 1,080 | 851 | 1,173 | 1,063 | 1,034 | 975 | 936 | 1,639 | 2,343 | 2,914 |
| 1995 | 2,504 | 1,894 | 1,485 | 919 | 946 | 783 | 791 | 788 | 1,325 | 1,952 | 2,808 | 3,097 |
| 1996 | 2,845 | 2,045 | 1,234 | 783 | 651 | 775 | 721 | 788 | 1,114 | 1,575 | 1,542 | 2,128 |
| 1997 | 2,033 | 2,006 | 1,318 | 898 | 778 | 729 | 658 | 557 | 1,073 | 1,835 | 2,309 | 2,214 |
| 1998 | 2,411 | 1,817 | 1,150 | 576 | 695 | 625 | 797 | 734 | 622 | 1,783 | 2,314 | 2,327 |
| 1999 | 2,065 | 1,597 | 1,318 | 784 | 717 | 666 | 648 | 650 | 1,093 | 1,435 | 1,823 | 2,299 |
| 2000 | 2,023 | 1,412 | 1,413 | 840 | 801 | 804 | 773 | 757 | 1,167 | 1,674 | 2,021 | 1,897 |
| 2001 | 2,076 | 1,613 | 1,171 | 799 | 973 | 706 | 646 | 616 | 1,145 | 1,990 | 2,309 | 2,519 |
| 2002 | 2,736 | 1,930 | 1,414 | 826 | 765 | 750 | 797 | 789 | 1,031 | 1,805 | 2,571 | 2,708 |
| 2003 | 2,462 | 1,999 | 1,129 | 663 | 714 | 660 | 711 | 802 | 699 | 1,319 | 1,987 | 1,991 |
| 2004 | 2,128 | 1,666 | 1,285 | 742 | 902 | 983 | 985 | 934 | 1,233 | 1,773 | 2,138 | 2,741 |
| 2005 | 2,144 | 1,749 | 1,006 | 916 | 972 | 1,098 | 1,079 | 1,115 | 1,479 | 2,454 | 2,854 | 2,995 |
| 2006 | 2,618 | 1,772 | 1,228 | 1,075 | 1,007 | 1,083 | 1,198 | 1,293 | 1,321 | 1,506 | 2,187 | 2,989 |
| 2007 | 2,501 | 1,663 | 1,164 | 1,118 | 1,197 | 999 | 1,195 | 1,116 | 1,273 | 1,403 | 2,183 | 2,389 |
| 2008 | 2,410 | 1,874 | 1,031 | 999 | 1,025 | 1,102 | 1,125 | 786 | 1,077 | 1,626 | 2,281 | 2,574 |
| 2009 | 2,292 | 1,959 | 1,457 | 1,036 | 1,093 | 1,112 | 1,039 | 1,056 | 1,219 | 1,895 | 2,525 | 2,449 |
| 2010 | 2,411 | 1,687 | 1,090 | 933 | 979 | 986 | 864 | 1,022 | 931 | 1,354 | 2,135 | 2,544 |
| 2011 | 2,605 | 1,639 | 1,460 | 989 | 791 | 862 | 993 | 981 | 1,145 | 1,386 | 1,884 | 2,195 |
| 2012 | 1,965 | 1,742 | 1,122 | 912 | 837 | 1,027 | 1,081 | 1,058 | 1,440 | 2,168 | 2,321 | 2,411 |
| 2013 | 1,934 | 1,611 | 1,232 | 808 | 717 | 951 | 1,033 | 1,151 | 1,237 | 1,632 | 1,791 | 2,121 |
| 2014 | 1,931 | 1,551 | 1,239 | 846 | 1,003 | 922 | 1,099 | 948 | 1,121 | 1,723 | 2,290 | 2,276 |
| 2015 | 1,969 | 1,766 | 1,368 | 987 | 728 | 717 | 847 | 1,192 | 1,366 | 1,719 | 2,225 | 2,375 |
| 2016 | 2,585 | 1,898 | 1,641 | 1,398 | 1,015 | 1,047 | 1,162 | 1,256 | 1,476 | 2,406 | 2,637 | 2,746 |
| 2017 | 2,447 | 1,772 | 1,340 | 1,167 | 1,177 | 975 | 1,135 | 1,174 | 1,571 | 1,677 | 1,750 | 2,436 |
| 2018 | 2,154 | 1,848 | 1,489 | 1,491 | 1,237 | 1,278 | 1,004 | 1,114 | 1,260 | 1,753 | 1,999 | 2,357 |
| 2019 | 1,769 | 1,516 | 1,378 | 1,075 | 805 | 853 | 1,117 | 1,196 | 1,452 | 2,106 | 2,115 | 2,070 |
| 2020 | 2,071 | 2,084 | 1,236 | 686 | 851 | 675 | 826 | 979 | 1,231 | 1,797 | 1,877 | 1,443 |
| 2021 | 1,737 | 1,346 | 1,216 | 938 | 884 | 1,123 | 1,155 | 1,099 | 1,142 | 1,748 | 1,949 | 2,207 |
| 2022 | -- | -- | -- | -- | -- | -- | -- | -- | -- | -- | -- | -- |
| 2023 | -- | -- | -- | -- | -- | -- | -- | -- | -- | -- | -- | -- |
| 2024 | -- | |||||||||||
| - = No Data Reported; -- = Not Applicable; NA = Not Available; W = Withheld to avoid disclosure of individual company data. |
| Release Date: 3/29/2024 |
| Next Release Date: 4/30/2024 |