|
Download Data (XLS File) |
|
||||||||
|
||||||||
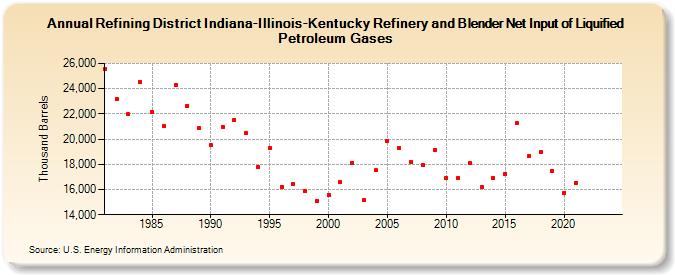
| Refining District Indiana-Illinois-Kentucky Refinery and Blender Net Input of Liquified Petroleum Gases (Thousand Barrels) | ||||||||
| Decade | Year-0 | Year-1 | Year-2 | Year-3 | Year-4 | Year-5 | Year-6 | Year-7 | Year-8 | Year-9 |
|---|---|---|---|---|---|---|---|---|---|---|
| 1980's | 25,527 | 23,190 | 21,953 | 24,539 | 22,185 | 21,019 | 24,306 | 22,653 | 20,873 | |
| 1990's | 19,507 | 20,989 | 21,537 | 20,449 | 17,774 | 19,292 | 16,201 | 16,408 | 15,851 | 15,095 |
| 2000's | 15,582 | 16,563 | 18,122 | 15,136 | 17,510 | 19,861 | 19,277 | 18,201 | 17,910 | 19,132 |
| 2010's | 16,936 | 16,930 | 18,084 | 16,218 | 16,949 | 17,259 | 21,267 | 18,621 | 18,984 | 17,452 |
| 2020's | 15,756 | 16,544 | -- | -- |
| - = No Data Reported; -- = Not Applicable; NA = Not Available; W = Withheld to avoid disclosure of individual company data. |
| Release Date: 6/28/2024 |
| Next Release Date: 8/30/2024 |