|
Download Data (XLS File) |
|
||||||||
|
||||||||
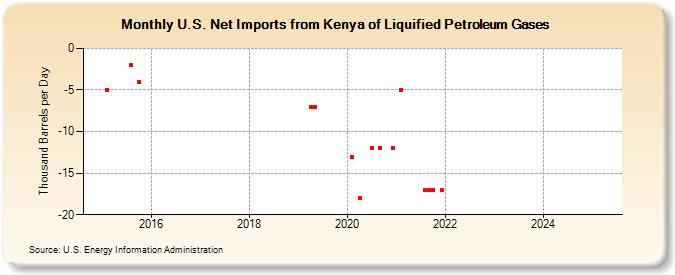
| U.S. Net Imports from Kenya of Liquified Petroleum Gases (Thousand Barrels per Day) | ||||||||
| Year | Jan | Feb | Mar | Apr | May | Jun | Jul | Aug | Sep | Oct | Nov | Dec |
|---|---|---|---|---|---|---|---|---|---|---|---|---|
| 2015 | -5 | -2 | -4 | |||||||||
| 2019 | -7 | -7 | ||||||||||
| 2020 | -13 | -18 | -12 | -12 | -12 | |||||||
| 2021 | -5 | -17 | -17 | -17 | -17 | |||||||
| 2022 | -- | -- | -- | -- | -- | -- | -- | |||||
| 2023 | -- | -- | -- | -- | -- | -- | -- | |||||
| 2024 | -- | |||||||||||
| - = No Data Reported; -- = Not Applicable; NA = Not Available; W = Withheld to avoid disclosure of individual company data. |
| Release Date: 3/29/2024 |
| Next Release Date: 4/30/2024 |