|
Download Data (XLS File) |
|
||||||||
|
||||||||
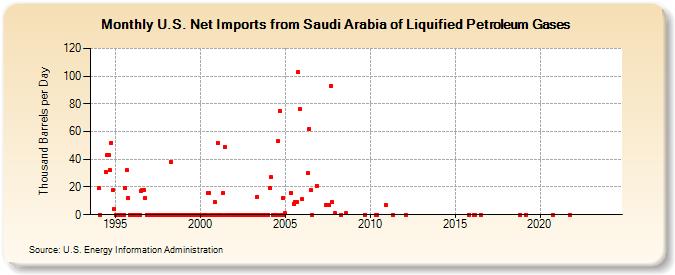
| U.S. Net Imports from Saudi Arabia of Liquified Petroleum Gases (Thousand Barrels per Day) | ||||||||
| Year | Jan | Feb | Mar | Apr | May | Jun | Jul | Aug | Sep | Oct | Nov | Dec |
|---|---|---|---|---|---|---|---|---|---|---|---|---|
| 1994 | 19 | 0 | 31 | 43 | 43 | 32 | 52 | 18 | 4 | |||
| 1995 | 0 | 0 | 0 | 0 | 0 | 0 | 0 | 19 | 32 | 12 | 0 | 0 |
| 1996 | 0 | 0 | 0 | 0 | 0 | 0 | 17 | 18 | 18 | 12 | 0 | 0 |
| 1997 | 0 | 0 | 0 | 0 | 0 | 0 | 0 | 0 | 0 | 0 | 0 | 0 |
| 1998 | 0 | 0 | 0 | 38 | 0 | 0 | 0 | 0 | 0 | 0 | 0 | 0 |
| 1999 | 0 | 0 | 0 | 0 | 0 | 0 | 0 | 0 | 0 | 0 | 0 | 0 |
| 2000 | 0 | 0 | 0 | 0 | 0 | 16 | 16 | 0 | 0 | 0 | 9 | 0 |
| 2001 | 52 | 0 | 0 | 0 | 16 | 49 | 0 | 0 | 0 | 0 | 0 | 0 |
| 2002 | 0 | 0 | 0 | 0 | 0 | 0 | 0 | 0 | 0 | 0 | 0 | 0 |
| 2003 | 0 | 0 | 0 | 0 | 13 | 0 | 0 | 0 | 0 | 0 | 0 | 0 |
| 2004 | 0 | 19 | 27 | 0 | 0 | 0 | 0 | 53 | 75 | 0 | 12 | 0 |
| 2005 | 1 | 16 | 8 | 9 | 9 | 103 | 76 | |||||
| 2006 | 11 | 30 | 62 | 18 | 0 | 21 | ||||||
| 2007 | 7 | 7 | 93 | 9 | 1 | |||||||
| 2008 | 0 | 1 | ||||||||||
| 2009 | 0 | |||||||||||
| 2010 | 0 | 0 | 7 | |||||||||
| 2011 | 0 | |||||||||||
| 2012 | 0 | |||||||||||
| 2015 | 0 | |||||||||||
| 2016 | 0 | 0 | 0 | |||||||||
| 2018 | 0 | |||||||||||
| 2019 | 0 | |||||||||||
| 2020 | 0 | |||||||||||
| 2021 | 0 | |||||||||||
| 2023 | -- | |||||||||||
| - = No Data Reported; -- = Not Applicable; NA = Not Available; W = Withheld to avoid disclosure of individual company data. |
| Release Date: 3/29/2024 |
| Next Release Date: 4/30/2024 |