|
Download Data (XLS File) |
|
||||||||
|
||||||||
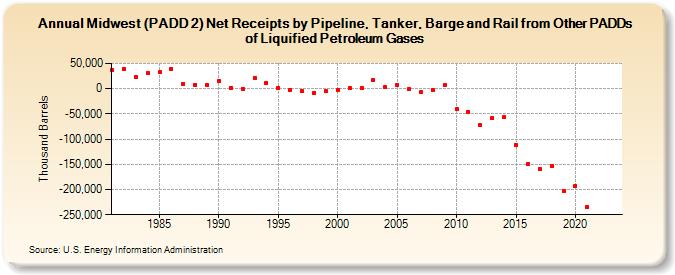
| Midwest (PADD 2) Net Receipts by Pipeline, Tanker, Barge and Rail from Other PADDs of Liquified Petroleum Gases (Thousand Barrels) | ||||||||
| Decade | Year-0 | Year-1 | Year-2 | Year-3 | Year-4 | Year-5 | Year-6 | Year-7 | Year-8 | Year-9 |
|---|---|---|---|---|---|---|---|---|---|---|
| 1980's | 36,948 | 39,593 | 23,976 | 31,437 | 32,443 | 39,932 | 9,504 | 7,880 | 6,811 | |
| 1990's | 15,707 | 2,088 | 228 | 21,361 | 10,859 | 887 | -1,689 | -4,889 | -7,631 | -5,530 |
| 2000's | -1,983 | 819 | 1,632 | 16,456 | 3,216 | 8,116 | 173 | -7,276 | -2,131 | 6,413 |
| 2010's | -41,238 | -46,242 | -72,885 | -59,095 | -57,107 | -110,778 | -149,633 | -158,706 | -152,737 | -203,016 |
| 2020's | -192,084 | -234,700 | -- | -- |
| - = No Data Reported; -- = Not Applicable; NA = Not Available; W = Withheld to avoid disclosure of individual company data. |
| Release Date: 8/30/2024 |
| Next Release Date: 8/29/2025 |
Referring Pages: