|
Download Data (XLS File) |
|
||||||||
|
||||||||
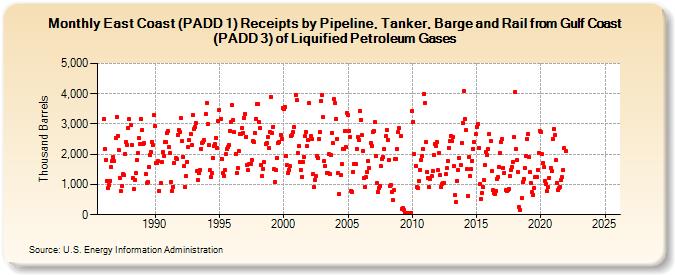
| East Coast (PADD 1) Receipts by Pipeline, Tanker, Barge and Rail from Gulf Coast (PADD 3) of Liquified Petroleum Gases (Thousand Barrels) | ||||||||
| Year | Jan | Feb | Mar | Apr | May | Jun | Jul | Aug | Sep | Oct | Nov | Dec |
|---|---|---|---|---|---|---|---|---|---|---|---|---|
| 1986 | 3,153 | 2,159 | 1,824 | 1,126 | 870 | 966 | 1,126 | 1,576 | 1,785 | 1,898 | 1,772 | 2,541 |
| 1987 | 3,244 | 2,611 | 2,147 | 1,226 | 790 | 958 | 1,340 | 1,298 | 2,023 | 2,407 | 2,309 | 2,868 |
| 1988 | 3,149 | 2,978 | 2,318 | 1,214 | 844 | 1,149 | 1,374 | 1,819 | 2,039 | 2,522 | 2,341 | 3,163 |
| 1989 | 2,816 | 2,331 | 2,356 | 1,340 | 1,053 | 1,086 | 1,577 | 1,972 | 2,079 | 2,415 | 2,300 | 3,286 |
| 1990 | 2,925 | 1,723 | 1,715 | 1,761 | 792 | 1,035 | 1,739 | 2,072 | 1,928 | 2,389 | 2,399 | 2,717 |
| 1991 | 2,761 | 2,238 | 2,028 | 1,067 | 780 | 924 | 1,710 | 1,868 | 1,839 | 2,641 | 2,803 | 2,737 |
| 1992 | 3,188 | 2,431 | 1,919 | 1,617 | 914 | 1,278 | 1,757 | 2,229 | 2,460 | 2,671 | 2,302 | 3,285 |
| 1993 | 2,834 | 2,909 | 3,017 | 1,435 | 1,158 | 1,369 | 1,478 | 2,182 | 2,370 | 2,418 | 2,457 | 3,330 |
| 1994 | 3,705 | 2,985 | 2,313 | 1,464 | 1,240 | 1,383 | 1,860 | 2,257 | 2,340 | 2,547 | 2,202 | 3,088 |
| 1995 | 3,456 | 3,179 | 1,850 | 1,364 | 1,290 | 1,479 | 1,991 | 2,172 | 2,225 | 2,312 | 2,783 | 3,067 |
| 1996 | 3,618 | 3,130 | 2,731 | 2,022 | 1,373 | 1,540 | 2,095 | 2,663 | 2,674 | 2,873 | 2,702 | 3,203 |
| 1997 | 3,337 | 2,584 | 1,654 | 1,467 | 1,672 | 1,685 | 1,815 | 2,441 | 2,404 | 2,712 | 3,175 | 3,676 |
| 1998 | 3,644 | 3,052 | 2,872 | 1,645 | 1,272 | 1,523 | 1,727 | 2,331 | 2,365 | 2,564 | 2,214 | 2,750 |
| 1999 | 3,903 | 2,711 | 2,911 | 1,499 | 1,078 | 1,469 | 1,891 | 2,364 | 2,416 | 2,646 | 2,502 | 3,542 |
| 2000 | 3,481 | 3,571 | 1,950 | 1,628 | 1,382 | 1,469 | 1,602 | 2,611 | 2,642 | 2,740 | 2,900 | 3,950 |
| 2001 | 3,805 | 2,053 | 2,268 | 1,742 | 1,489 | 1,256 | 1,748 | 1,917 | 2,592 | 2,741 | 2,262 | 2,464 |
| 2002 | 3,680 | 2,591 | 2,488 | 1,339 | 914 | 1,157 | 1,293 | 1,952 | 1,869 | 2,511 | 2,723 | 3,769 |
| 2003 | 3,971 | 3,217 | 1,760 | 1,601 | 1,394 | 1,390 | 1,996 | 1,338 | 1,969 | 2,711 | 2,362 | 3,810 |
| 2004 | 3,680 | 3,166 | 2,518 | 1,369 | 690 | 1,307 | 1,670 | 2,188 | 2,180 | 2,766 | 2,234 | 3,363 |
| 2005 | 3,300 | 2,777 | 2,581 | 795 | 761 | 1,417 | 1,672 | 1,679 | 2,184 | 2,573 | 2,457 | 3,421 |
| 2006 | 3,143 | 2,620 | 2,109 | 1,202 | 913 | 1,233 | 1,415 | 1,788 | 1,546 | 2,369 | 2,281 | 2,740 |
| 2007 | 2,773 | 3,060 | 1,954 | 1,048 | 762 | 896 | 939 | 1,597 | 1,849 | 1,898 | 2,188 | 2,589 |
| 2008 | 2,812 | 2,473 | 1,809 | 948 | 987 | 760 | 485 | 820 | 1,842 | 1,844 | 2,178 | 2,732 |
| 2009 | 2,852 | 2,603 | 205 | 207 | 162 | 44 | 50 | 50 | 44 | 46 | 45 | 64 |
| 2010 | 3,434 | 3,071 | 2,007 | 1,614 | 905 | 890 | 1,115 | 1,482 | 1,803 | 1,945 | 2,172 | 4,003 |
| 2011 | 3,704 | 2,402 | 1,413 | 1,227 | 905 | 1,190 | 1,271 | 1,452 | 1,974 | 2,351 | 2,272 | 2,417 |
| 2012 | 1,469 | 2,052 | 1,311 | 929 | 1,031 | 1,047 | 1,050 | 1,333 | 1,533 | 1,792 | 2,210 | 2,434 |
| 2013 | 2,616 | 2,431 | 2,568 | 1,598 | 639 | 427 | 1,130 | 1,472 | 1,865 | 1,629 | 2,386 | 3,036 |
| 2014 | 4,090 | 3,168 | 2,789 | 1,497 | 625 | 1,923 | 1,264 | 1,511 | 1,789 | 2,166 | 2,399 | 2,659 |
| 2015 | 2,906 | 2,986 | 2,218 | 1,009 | 516 | 727 | 905 | 1,151 | 1,628 | 2,062 | 1,966 | 2,179 |
| 2016 | 2,682 | 2,442 | 1,451 | 807 | 715 | 698 | 790 | 1,191 | 1,231 | 1,587 | 2,042 | 2,393 |
| 2017 | 2,504 | 1,552 | 1,394 | 805 | 786 | 806 | 852 | 1,272 | 1,482 | 1,585 | 1,744 | 2,555 |
| 2018 | 4,053 | 2,162 | 1,814 | 1,411 | 241 | 151 | 553 | 1,068 | 1,184 | 1,557 | 1,938 | 2,517 |
| 2019 | 2,666 | 1,903 | 1,410 | 1,044 | 737 | 659 | 891 | 1,253 | 1,256 | 1,492 | 2,041 | 2,771 |
| 2020 | 2,732 | 1,995 | 1,709 | 1,569 | 1,118 | 1,028 | 770 | 907 | 1,226 | 1,560 | 1,436 | 2,511 |
| 2021 | 2,841 | 2,632 | 1,793 | 1,064 | 816 | 870 | 925 | 1,132 | 1,235 | 1,480 | 2,190 | 2,114 |
| 2022 | -- | -- | -- | -- | -- | -- | -- | -- | -- | -- | -- | -- |
| 2023 | -- | -- | -- | -- | -- | -- | -- | -- | -- | -- | -- | -- |
| 2024 | -- | -- | -- | -- | ||||||||
| - = No Data Reported; -- = Not Applicable; NA = Not Available; W = Withheld to avoid disclosure of individual company data. |
| Release Date: 6/28/2024 |
| Next Release Date: 7/31/2024 |