|
Download Data (XLS File) |
|
||||||||
|
||||||||
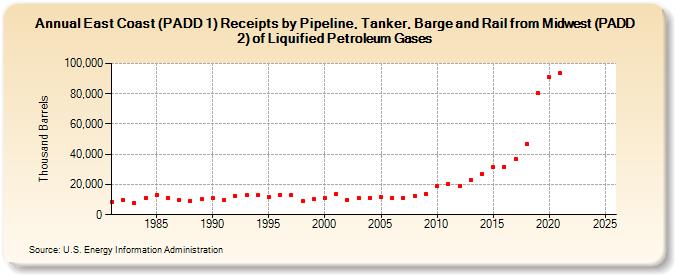
| East Coast (PADD 1) Receipts by Pipeline, Tanker, Barge and Rail from Midwest (PADD 2) of Liquified Petroleum Gases (Thousand Barrels) | ||||||||
| Decade | Year-0 | Year-1 | Year-2 | Year-3 | Year-4 | Year-5 | Year-6 | Year-7 | Year-8 | Year-9 |
|---|---|---|---|---|---|---|---|---|---|---|
| 1980's | 8,736 | 9,837 | 7,843 | 11,201 | 13,265 | 11,342 | 9,851 | 9,360 | 10,079 | |
| 1990's | 10,835 | 9,975 | 12,474 | 12,755 | 12,815 | 11,588 | 13,163 | 12,853 | 9,088 | 10,162 |
| 2000's | 11,357 | 13,720 | 10,031 | 10,909 | 11,228 | 11,522 | 11,076 | 11,293 | 12,517 | 14,012 |
| 2010's | 18,969 | 20,242 | 18,701 | 22,796 | 27,113 | 31,330 | 31,564 | 36,817 | 46,639 | 80,195 |
| 2020's | 90,868 | 93,400 | -- | -- |
| - = No Data Reported; -- = Not Applicable; NA = Not Available; W = Withheld to avoid disclosure of individual company data. |
| Release Date: 3/29/2024 |
| Next Release Date: 8/30/2024 |