|
Download Data (XLS File) |
|
||||||||
|
||||||||
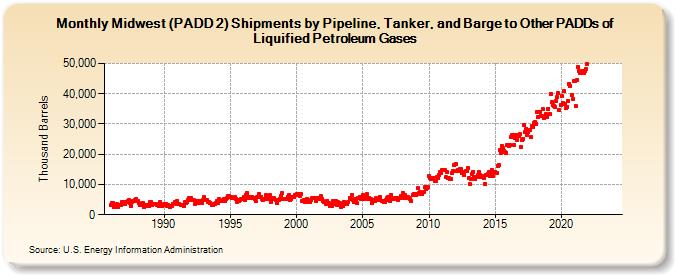
| Midwest (PADD 2) Shipments by Pipeline, Tanker, and Barge to Other PADDs of Liquified Petroleum Gases (Thousand Barrels) | ||||||||
| Year | Jan | Feb | Mar | Apr | May | Jun | Jul | Aug | Sep | Oct | Nov | Dec |
|---|---|---|---|---|---|---|---|---|---|---|---|---|
| 1986 | 3,350 | 3,727 | 3,950 | 2,523 | 2,544 | 3,450 | 2,699 | 3,048 | 3,145 | 3,055 | 4,208 | 3,437 |
| 1987 | 4,079 | 3,580 | 4,282 | 4,479 | 4,830 | 3,991 | 2,806 | 4,070 | 4,419 | 4,372 | 4,945 | 5,239 |
| 1988 | 4,461 | 3,778 | 3,088 | 3,595 | 3,572 | 3,761 | 2,433 | 3,088 | 2,970 | 3,049 | 2,734 | 4,175 |
| 1989 | 4,175 | 3,092 | 3,421 | 3,409 | 3,554 | 3,476 | 3,102 | 2,862 | 4,181 | 3,019 | 3,029 | 3,227 |
| 1990 | 3,467 | 3,412 | 3,465 | 3,006 | 3,356 | 2,464 | 2,774 | 2,804 | 3,673 | 3,600 | 4,089 | 4,165 |
| 1991 | 4,567 | 3,619 | 3,568 | 3,252 | 3,201 | 3,153 | 2,793 | 4,104 | 4,037 | 4,043 | 4,803 | 5,406 |
| 1992 | 5,536 | 4,998 | 4,702 | 4,740 | 3,453 | 4,269 | 4,405 | 4,034 | 4,389 | 4,385 | 3,929 | 4,888 |
| 1993 | 5,735 | 4,728 | 4,858 | 4,801 | 4,181 | 4,074 | 3,947 | 3,369 | 3,140 | 3,519 | 3,535 | 3,963 |
| 1994 | 4,585 | 3,953 | 5,047 | 4,535 | 4,441 | 4,806 | 5,094 | 4,523 | 5,041 | 5,394 | 6,035 | 6,044 |
| 1995 | 5,767 | 5,761 | 5,485 | 5,523 | 5,764 | 5,168 | 4,280 | 4,859 | 4,384 | 5,018 | 5,223 | 5,156 |
| 1996 | 5,785 | 5,007 | 6,682 | 7,227 | 5,597 | 5,910 | 5,757 | 5,579 | 5,922 | 5,446 | 5,215 | 4,448 |
| 1997 | 5,772 | 5,854 | 6,907 | 5,914 | 5,917 | 5,120 | 4,981 | 5,154 | 6,392 | 5,503 | 5,193 | 5,304 |
| 1998 | 6,365 | 4,304 | 5,665 | 5,178 | 5,460 | 4,863 | 3,914 | 4,810 | 4,859 | 5,173 | 6,120 | 7,127 |
| 1999 | 5,350 | 5,234 | 5,187 | 5,127 | 5,990 | 6,441 | 4,720 | 5,298 | 5,803 | 5,786 | 5,985 | 6,660 |
| 2000 | 6,804 | 6,798 | 6,461 | 6,335 | 6,700 | 4,554 | 4,617 | 4,855 | 4,339 | 5,188 | 4,557 | 4,368 |
| 2001 | 4,135 | 5,012 | 5,418 | 5,526 | 5,548 | 5,561 | 4,694 | 5,374 | 5,615 | 5,187 | 6,045 | 5,036 |
| 2002 | 4,593 | 4,367 | 4,225 | 3,675 | 4,672 | 4,025 | 2,863 | 3,436 | 2,952 | 4,553 | 3,782 | 3,484 |
| 2003 | 4,430 | 3,076 | 4,058 | 4,028 | 2,650 | 3,312 | 2,787 | 4,304 | 4,007 | 3,763 | 3,664 | 4,235 |
| 2004 | 5,606 | 5,143 | 6,520 | 4,807 | 4,341 | 5,172 | 4,685 | 3,784 | 5,415 | 5,855 | 5,282 | 5,682 |
| 2005 | 6,376 | 5,279 | 6,039 | 6,040 | 6,700 | 5,278 | 5,533 | 5,087 | 3,935 | 4,842 | 5,013 | 4,562 |
| 2006 | 5,549 | 5,098 | 4,749 | 5,141 | 5,704 | 4,666 | 4,690 | 4,209 | 4,217 | 4,750 | 5,445 | 5,764 |
| 2007 | 5,811 | 4,398 | 6,442 | 5,356 | 5,115 | 5,596 | 5,554 | 5,362 | 4,789 | 5,372 | 5,636 | 6,285 |
| 2008 | 7,324 | 5,660 | 6,677 | 5,642 | 5,795 | 5,776 | 5,595 | 5,258 | 4,574 | 6,663 | 6,936 | 6,555 |
| 2009 | 6,560 | 6,852 | 8,724 | 7,180 | 7,615 | 6,993 | 6,792 | 7,346 | 9,073 | 8,585 | 8,673 | 9,062 |
| 2010 | 12,662 | 12,022 | 11,935 | 11,860 | 12,201 | 11,304 | 11,016 | 12,524 | 12,176 | 12,972 | 14,266 | 13,873 |
| 2011 | 14,677 | 14,673 | 14,646 | 12,344 | 14,124 | 12,140 | 12,039 | 11,954 | 11,839 | 13,884 | 14,344 | 16,510 |
| 2012 | 16,866 | 14,597 | 14,880 | 14,537 | 15,054 | 15,109 | 13,664 | 14,236 | 13,046 | 14,315 | 14,502 | 15,403 |
| 2013 | 12,209 | 10,009 | 11,726 | 13,317 | 14,176 | 12,590 | 11,786 | 12,587 | 12,966 | 14,244 | 13,093 | 12,397 |
| 2014 | 12,853 | 12,465 | 12,165 | 10,240 | 13,194 | 13,329 | 14,000 | 12,853 | 13,454 | 14,857 | 12,921 | 13,980 |
| 2015 | 14,152 | 13,818 | 16,179 | 16,574 | 21,273 | 20,462 | 22,663 | 21,952 | 20,977 | 20,682 | 20,561 | 23,100 |
| 2016 | 22,776 | 23,078 | 25,819 | 26,334 | 26,337 | 23,127 | 25,346 | 26,272 | 24,813 | 26,153 | 26,554 | 22,548 |
| 2017 | 24,755 | 25,167 | 29,509 | 27,247 | 28,478 | 26,372 | 27,183 | 28,042 | 25,635 | 29,446 | 29,070 | 30,390 |
| 2018 | 30,728 | 30,075 | 34,058 | 32,291 | 33,810 | 32,563 | 32,701 | 34,833 | 32,137 | 32,248 | 33,215 | 32,274 |
| 2019 | 35,012 | 33,312 | 40,065 | 37,145 | 36,335 | 35,970 | 35,631 | 37,617 | 38,871 | 40,124 | 34,657 | 36,271 |
| 2020 | 39,195 | 36,912 | 40,814 | 36,448 | 35,407 | 35,640 | 37,537 | 43,279 | 42,679 | 39,710 | 38,165 | 44,088 |
| 2021 | 44,144 | 35,809 | 44,484 | 48,881 | 47,369 | 46,923 | 47,294 | 47,614 | 46,707 | 47,533 | 48,123 | 49,897 |
| 2022 | -- | -- | -- | -- | -- | -- | -- | -- | -- | -- | -- | -- |
| 2023 | -- | -- | -- | -- | -- | -- | -- | -- | -- | -- | -- | -- |
| 2024 | -- | |||||||||||
| - = No Data Reported; -- = Not Applicable; NA = Not Available; W = Withheld to avoid disclosure of individual company data. |
| Release Date: 3/29/2024 |
| Next Release Date: 4/30/2024 |
Referring Pages: