|
Download Data (XLS File) |
|
||||||||
|
||||||||
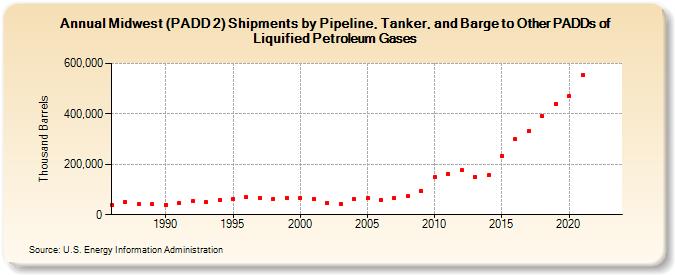
| Midwest (PADD 2) Shipments by Pipeline, Tanker, and Barge to Other PADDs of Liquified Petroleum Gases (Thousand Barrels) | ||||||||
| Decade | Year-0 | Year-1 | Year-2 | Year-3 | Year-4 | Year-5 | Year-6 | Year-7 | Year-8 | Year-9 |
|---|---|---|---|---|---|---|---|---|---|---|
| 1980's | 39,136 | 51,092 | 40,704 | 40,547 | ||||||
| 1990's | 40,275 | 46,546 | 53,728 | 49,850 | 59,498 | 62,388 | 68,575 | 68,011 | 63,838 | 67,581 |
| 2000's | 65,576 | 63,151 | 46,627 | 44,314 | 62,292 | 64,684 | 59,982 | 65,716 | 72,455 | 93,455 |
| 2010's | 148,811 | 163,174 | 176,209 | 151,100 | 156,311 | 232,393 | 299,157 | 331,294 | 390,933 | 441,010 |
| 2020's | 469,874 | 554,778 | -- | -- |
| - = No Data Reported; -- = Not Applicable; NA = Not Available; W = Withheld to avoid disclosure of individual company data. |
| Release Date: 6/28/2024 |
| Next Release Date: 8/30/2024 |
Referring Pages: