|
Download Data (XLS File) |
|
||||||||
|
||||||||
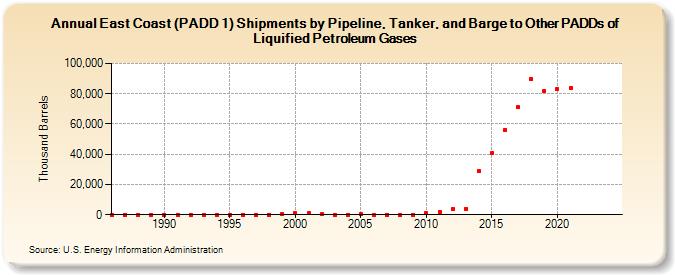
| East Coast (PADD 1) Shipments by Pipeline, Tanker, and Barge to Other PADDs of Liquified Petroleum Gases (Thousand Barrels) | ||||||||
| Decade | Year-0 | Year-1 | Year-2 | Year-3 | Year-4 | Year-5 | Year-6 | Year-7 | Year-8 | Year-9 |
|---|---|---|---|---|---|---|---|---|---|---|
| 1980's | 0 | 0 | 9 | 0 | ||||||
| 1990's | 50 | 0 | 1 | 0 | 0 | 0 | 50 | 40 | 0 | 562 |
| 2000's | 811 | 875 | 446 | 19 | 0 | 145 | 0 | 0 | 0 | 0 |
| 2010's | 873 | 1,851 | 3,879 | 4,062 | 28,674 | 40,651 | 56,119 | 71,098 | 89,737 | 81,888 |
| 2020's | 83,069 | 83,805 | -- | -- |
| - = No Data Reported; -- = Not Applicable; NA = Not Available; W = Withheld to avoid disclosure of individual company data. |
| Release Date: 3/29/2024 |
| Next Release Date: 8/30/2024 |
Referring Pages: