|
Download Data (XLS File) |
|
||||||||
|
||||||||
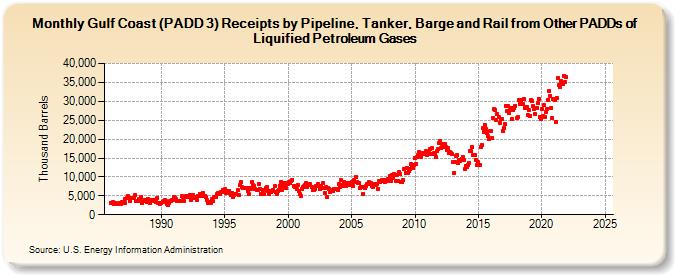
| Gulf Coast (PADD 3) Receipts by Pipeline, Tanker, Barge and Rail from Other PADDs of Liquified Petroleum Gases (Thousand Barrels) | ||||||||
| Year | Jan | Feb | Mar | Apr | May | Jun | Jul | Aug | Sep | Oct | Nov | Dec |
|---|---|---|---|---|---|---|---|---|---|---|---|---|
| 1986 | 3,194 | 3,043 | 3,344 | 2,917 | 2,977 | 2,937 | 2,817 | 2,719 | 3,099 | 2,776 | 2,965 | 3,431 |
| 1987 | 3,302 | 3,149 | 4,249 | 4,422 | 4,998 | 4,290 | 3,568 | 4,489 | 4,315 | 4,466 | 4,498 | 5,097 |
| 1988 | 3,750 | 3,576 | 3,561 | 4,156 | 4,148 | 4,575 | 3,071 | 3,577 | 3,909 | 4,011 | 3,424 | 4,093 |
| 1989 | 3,737 | 3,159 | 3,789 | 3,864 | 3,869 | 3,539 | 3,768 | 3,256 | 4,499 | 3,189 | 3,088 | 2,953 |
| 1990 | 3,186 | 3,486 | 3,678 | 3,767 | 3,701 | 2,847 | 2,611 | 3,153 | 3,634 | 3,696 | 3,893 | 3,900 |
| 1991 | 4,693 | 4,514 | 4,220 | 3,537 | 3,662 | 3,712 | 3,724 | 4,851 | 3,787 | 3,581 | 4,751 | 4,901 |
| 1992 | 4,890 | 4,635 | 4,658 | 5,151 | 3,839 | 4,634 | 5,164 | 4,475 | 4,808 | 4,488 | 3,834 | 4,960 |
| 1993 | 5,519 | 4,889 | 5,262 | 5,769 | 4,947 | 4,930 | 4,661 | 3,991 | 3,197 | 3,236 | 3,139 | 3,169 |
| 1994 | 4,026 | 3,521 | 4,760 | 4,602 | 4,719 | 5,451 | 5,614 | 5,354 | 5,890 | 6,061 | 6,643 | 6,662 |
| 1995 | 6,703 | 5,867 | 6,152 | 6,164 | 6,336 | 5,820 | 5,121 | 5,811 | 4,774 | 5,344 | 5,426 | 5,601 |
| 1996 | 6,419 | 5,135 | 7,848 | 8,638 | 7,323 | 6,997 | 7,171 | 7,093 | 7,024 | 7,048 | 6,382 | 5,373 |
| 1997 | 7,045 | 6,879 | 8,668 | 7,730 | 7,550 | 6,842 | 6,454 | 6,550 | 8,114 | 6,866 | 5,536 | 5,581 |
| 1998 | 6,622 | 5,369 | 6,537 | 7,084 | 7,222 | 6,320 | 5,550 | 6,379 | 6,008 | 6,378 | 6,653 | 7,497 |
| 1999 | 5,995 | 5,506 | 6,191 | 6,541 | 7,722 | 8,656 | 6,605 | 7,530 | 8,291 | 7,545 | 7,131 | 8,494 |
| 2000 | 8,229 | 8,528 | 8,413 | 8,941 | 9,255 | 7,603 | 7,393 | 7,594 | 6,886 | 7,901 | 6,386 | 5,369 |
| 2001 | 5,069 | 6,765 | 7,313 | 7,510 | 7,967 | 8,322 | 7,449 | 7,843 | 8,016 | 8,035 | 7,428 | 6,485 |
| 2002 | 6,658 | 6,885 | 7,577 | 7,480 | 8,082 | 7,499 | 6,705 | 7,656 | 6,944 | 8,377 | 6,979 | 5,730 |
| 2003 | 7,413 | 4,708 | 7,069 | 6,777 | 6,040 | 6,455 | 6,218 | 6,725 | 6,714 | 6,885 | 6,922 | 6,577 |
| 2004 | 8,167 | 7,366 | 9,138 | 7,768 | 7,531 | 8,563 | 8,443 | 7,586 | 8,179 | 8,511 | 7,824 | 8,198 |
| 2005 | 8,725 | 7,698 | 9,242 | 8,717 | 9,988 | 8,559 | 8,434 | 8,309 | 6,974 | 7,208 | 7,386 | 5,504 |
| 2006 | 7,255 | 6,968 | 7,511 | 8,147 | 8,538 | 8,184 | 8,290 | 7,482 | 7,451 | 7,908 | 8,062 | 7,824 |
| 2007 | 8,080 | 6,783 | 8,929 | 8,760 | 8,986 | 9,158 | 9,002 | 9,266 | 8,702 | 8,811 | 9,499 | 9,327 |
| 2008 | 10,162 | 9,043 | 10,552 | 9,795 | 10,777 | 10,381 | 8,867 | 10,467 | 8,926 | 11,324 | 10,813 | 8,555 |
| 2009 | 8,574 | 9,153 | 12,082 | 11,073 | 12,326 | 11,159 | 11,599 | 12,027 | 13,366 | 12,827 | 12,374 | 13,250 |
| 2010 | 14,956 | 13,421 | 15,175 | 15,803 | 16,565 | 15,418 | 15,164 | 16,361 | 16,150 | 16,323 | 16,827 | 15,879 |
| 2011 | 16,637 | 16,241 | 17,437 | 16,165 | 17,575 | 16,107 | 16,346 | 15,971 | 15,317 | 16,813 | 17,339 | 18,954 |
| 2012 | 19,586 | 17,578 | 18,642 | 17,901 | 18,586 | 17,932 | 17,095 | 17,766 | 16,409 | 16,485 | 16,349 | 16,052 |
| 2013 | 13,880 | 11,038 | 13,957 | 15,468 | 15,733 | 13,801 | 14,549 | 14,283 | 14,774 | 15,303 | 14,416 | 12,121 |
| 2014 | 12,997 | 12,731 | 13,227 | 13,710 | 16,745 | 16,740 | 17,823 | 15,851 | 15,821 | 15,713 | 14,443 | 13,211 |
| 2015 | 13,866 | 13,161 | 17,954 | 18,386 | 22,886 | 21,813 | 23,801 | 22,551 | 21,722 | 20,696 | 19,928 | 22,174 |
| 2016 | 22,109 | 20,350 | 25,598 | 27,956 | 27,810 | 24,922 | 26,728 | 25,860 | 24,352 | 25,396 | 25,312 | 22,117 |
| 2017 | 22,851 | 23,926 | 28,864 | 27,411 | 28,708 | 26,912 | 27,699 | 28,342 | 25,236 | 27,618 | 28,216 | 28,846 |
| 2018 | 25,618 | 25,905 | 30,289 | 29,382 | 30,230 | 29,230 | 29,194 | 30,527 | 28,240 | 28,370 | 28,440 | 26,346 |
| 2019 | 27,693 | 26,072 | 30,393 | 30,126 | 28,727 | 28,024 | 26,633 | 28,312 | 29,445 | 30,660 | 25,891 | 25,383 |
| 2020 | 27,945 | 26,095 | 28,936 | 25,863 | 27,224 | 28,023 | 30,434 | 32,740 | 31,520 | 28,294 | 25,624 | 30,663 |
| 2021 | 30,242 | 24,605 | 30,998 | 36,096 | 34,255 | 33,730 | 35,437 | 34,794 | 34,451 | 36,810 | 35,173 | 36,422 |
| 2022 | -- | -- | -- | -- | -- | -- | -- | -- | -- | -- | -- | -- |
| 2023 | -- | -- | -- | -- | -- | -- | -- | -- | -- | -- | -- | -- |
| 2024 | -- | |||||||||||
| - = No Data Reported; -- = Not Applicable; NA = Not Available; W = Withheld to avoid disclosure of individual company data. |
| Release Date: 3/29/2024 |
| Next Release Date: 4/30/2024 |
Referring Pages: