|
Download Data (XLS File) |
|
||||||||
|
||||||||
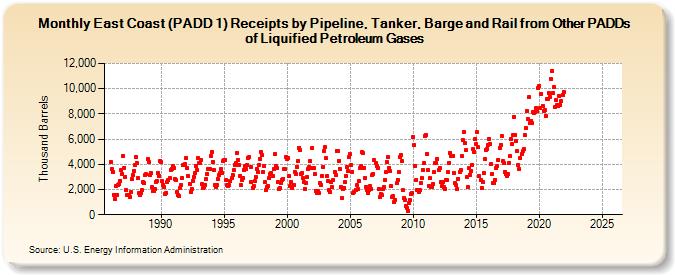
| East Coast (PADD 1) Receipts by Pipeline, Tanker, Barge and Rail from Other PADDs of Liquified Petroleum Gases (Thousand Barrels) | ||||||||
| Year | Jan | Feb | Mar | Apr | May | Jun | Jul | Aug | Sep | Oct | Nov | Dec |
|---|---|---|---|---|---|---|---|---|---|---|---|---|
| 1986 | 4,191 | 3,642 | 3,394 | 1,586 | 1,220 | 2,291 | 1,600 | 2,391 | 2,408 | 2,676 | 3,522 | 3,217 |
| 1987 | 4,672 | 3,742 | 3,018 | 1,956 | 1,568 | 1,541 | 1,409 | 1,803 | 2,806 | 3,143 | 3,503 | 3,911 |
| 1988 | 4,586 | 4,102 | 2,896 | 1,715 | 1,526 | 1,726 | 1,932 | 2,564 | 2,514 | 3,132 | 3,192 | 4,385 |
| 1989 | 4,204 | 3,123 | 3,324 | 2,163 | 1,898 | 1,899 | 2,062 | 2,618 | 2,695 | 3,309 | 3,094 | 4,301 |
| 1990 | 4,149 | 2,651 | 2,359 | 2,197 | 1,641 | 1,754 | 2,605 | 2,733 | 2,889 | 3,549 | 3,666 | 3,837 |
| 1991 | 3,708 | 2,804 | 2,735 | 1,768 | 1,555 | 1,524 | 2,131 | 2,361 | 2,932 | 3,924 | 3,936 | 3,993 |
| 1992 | 4,496 | 3,704 | 3,086 | 2,467 | 1,820 | 2,061 | 2,710 | 2,975 | 3,293 | 3,864 | 3,551 | 4,498 |
| 1993 | 4,113 | 4,097 | 4,340 | 2,433 | 2,125 | 2,215 | 2,388 | 2,846 | 3,217 | 3,642 | 3,655 | 4,641 |
| 1994 | 4,993 | 4,212 | 3,566 | 2,382 | 2,236 | 2,356 | 2,858 | 3,114 | 3,273 | 3,642 | 3,332 | 4,235 |
| 1995 | 4,312 | 4,375 | 2,720 | 2,353 | 2,304 | 2,331 | 2,681 | 2,875 | 3,168 | 3,537 | 3,983 | 4,117 |
| 1996 | 4,918 | 4,379 | 3,942 | 3,094 | 2,353 | 2,728 | 2,881 | 3,557 | 3,851 | 3,609 | 3,953 | 4,522 |
| 1997 | 4,594 | 3,780 | 2,603 | 2,148 | 2,308 | 2,658 | 2,985 | 3,634 | 3,369 | 3,966 | 4,429 | 5,001 |
| 1998 | 4,737 | 3,394 | 3,897 | 2,562 | 1,948 | 2,175 | 2,284 | 2,882 | 3,193 | 3,300 | 3,086 | 3,589 |
| 1999 | 4,793 | 3,895 | 3,674 | 2,560 | 2,024 | 2,152 | 2,552 | 2,761 | 2,868 | 3,610 | 3,589 | 4,616 |
| 2000 | 4,402 | 4,516 | 3,055 | 2,253 | 2,557 | 2,112 | 2,381 | 3,387 | 3,243 | 3,806 | 4,251 | 5,320 |
| 2001 | 5,162 | 3,203 | 3,280 | 2,944 | 2,595 | 2,054 | 2,487 | 2,978 | 3,644 | 3,769 | 4,237 | 3,704 |
| 2002 | 5,308 | 3,698 | 3,226 | 1,875 | 1,754 | 1,888 | 1,739 | 2,512 | 2,356 | 3,106 | 3,801 | 5,054 |
| 2003 | 5,342 | 4,495 | 3,039 | 2,655 | 1,929 | 1,799 | 2,572 | 2,200 | 2,740 | 3,408 | 3,155 | 5,094 |
| 2004 | 5,094 | 4,290 | 3,656 | 2,181 | 1,362 | 2,069 | 2,153 | 2,586 | 3,104 | 3,812 | 3,447 | 4,605 |
| 2005 | 4,788 | 3,929 | 3,416 | 1,741 | 1,815 | 1,956 | 2,331 | 2,055 | 2,645 | 3,687 | 3,827 | 4,949 |
| 2006 | 4,859 | 3,739 | 2,922 | 2,221 | 1,991 | 1,744 | 1,938 | 2,275 | 2,020 | 3,147 | 3,259 | 4,320 |
| 2007 | 4,119 | 3,859 | 3,693 | 2,022 | 1,395 | 1,671 | 1,567 | 2,023 | 2,186 | 2,750 | 3,391 | 4,170 |
| 2008 | 4,559 | 3,744 | 3,439 | 2,264 | 1,405 | 1,471 | 984 | 1,170 | 2,482 | 2,782 | 3,362 | 4,545 |
| 2009 | 4,758 | 4,239 | 1,947 | 1,303 | 1,184 | 699 | 540 | 334 | 903 | 1,142 | 1,609 | 1,726 |
| 2010 | 6,196 | 5,516 | 3,882 | 2,752 | 1,958 | 1,840 | 1,957 | 2,520 | 2,928 | 3,545 | 4,087 | 6,229 |
| 2011 | 6,330 | 4,839 | 3,575 | 2,289 | 2,877 | 2,205 | 2,227 | 2,470 | 3,377 | 4,096 | 4,088 | 4,447 |
| 2012 | 3,543 | 3,744 | 2,564 | 2,260 | 2,602 | 2,187 | 2,069 | 2,750 | 2,717 | 3,397 | 4,142 | 4,917 |
| 2013 | 4,638 | 4,695 | 4,684 | 3,301 | 2,494 | 2,324 | 2,057 | 2,860 | 3,414 | 3,564 | 4,634 | 5,928 |
| 2014 | 6,548 | 5,655 | 5,107 | 3,029 | 2,183 | 3,678 | 3,175 | 3,508 | 3,952 | 5,179 | 4,985 | 5,994 |
| 2015 | 5,577 | 6,524 | 5,339 | 3,079 | 2,748 | 2,126 | 2,593 | 3,284 | 4,388 | 5,171 | 5,215 | 5,539 |
| 2016 | 6,019 | 5,642 | 4,053 | 3,264 | 2,511 | 2,536 | 2,776 | 3,689 | 3,858 | 4,372 | 5,329 | 5,544 |
| 2017 | 6,252 | 4,264 | 4,104 | 3,379 | 3,231 | 3,086 | 3,238 | 4,109 | 4,628 | 5,978 | 5,597 | 6,288 |
| 2018 | 7,778 | 6,342 | 5,846 | 5,031 | 3,915 | 3,615 | 4,516 | 4,820 | 5,034 | 5,189 | 6,311 | 6,891 |
| 2019 | 8,252 | 7,605 | 9,310 | 7,275 | 7,437 | 7,284 | 8,158 | 8,103 | 8,147 | 8,486 | 8,228 | 10,033 |
| 2020 | 10,235 | 8,447 | 9,586 | 8,631 | 8,212 | 8,305 | 7,858 | 9,198 | 9,175 | 9,634 | 9,349 | 10,799 |
| 2021 | 11,414 | 9,680 | 10,144 | 8,552 | 9,063 | 8,667 | 8,602 | 9,425 | 8,710 | 9,003 | 9,502 | 9,730 |
| 2022 | -- | -- | -- | -- | -- | -- | -- | -- | -- | -- | -- | -- |
| 2023 | -- | -- | -- | -- | -- | -- | -- | -- | -- | -- | -- | -- |
| 2024 | -- | |||||||||||
| - = No Data Reported; -- = Not Applicable; NA = Not Available; W = Withheld to avoid disclosure of individual company data. |
| Release Date: 3/29/2024 |
| Next Release Date: 4/30/2024 |
Referring Pages: