|
Download Data (XLS File) |
|
||||||||
|
||||||||
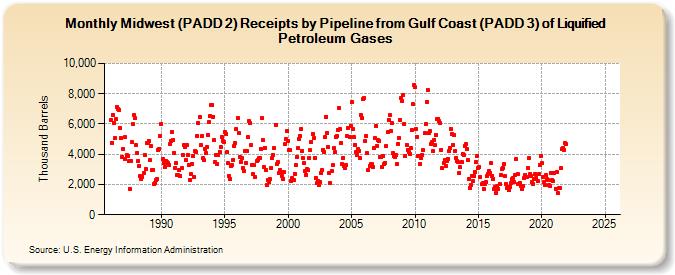
| Midwest (PADD 2) Receipts by Pipeline from Gulf Coast (PADD 3) of Liquified Petroleum Gases (Thousand Barrels) | ||||||||
| Year | Jan | Feb | Mar | Apr | May | Jun | Jul | Aug | Sep | Oct | Nov | Dec |
|---|---|---|---|---|---|---|---|---|---|---|---|---|
| 1986 | 6,238 | 4,775 | 6,623 | 6,052 | 5,059 | 6,338 | 7,135 | 6,991 | 6,948 | 5,726 | 5,072 | 3,849 |
| 1987 | 4,354 | 3,691 | 5,132 | 3,928 | 3,859 | 3,548 | 1,723 | 3,576 | 4,789 | 5,981 | 6,591 | 6,375 |
| 1988 | 4,623 | 4,111 | 3,574 | 3,243 | 2,555 | 2,338 | 2,523 | 2,756 | 3,974 | 3,032 | 4,732 | 4,745 |
| 1989 | 4,900 | 3,609 | 4,571 | 2,937 | 2,980 | 2,020 | 2,094 | 2,292 | 2,384 | 4,250 | 4,361 | 5,210 |
| 1990 | 6,026 | 3,664 | 3,392 | 3,125 | 3,569 | 3,458 | 3,392 | 3,294 | 4,661 | 4,894 | 5,441 | 4,970 |
| 1991 | 4,110 | 3,118 | 3,392 | 2,605 | 2,594 | 2,970 | 2,576 | 3,085 | 3,966 | 4,605 | 4,447 | 3,617 |
| 1992 | 4,609 | 3,942 | 3,308 | 2,320 | 2,666 | 3,385 | 3,890 | 2,509 | 4,220 | 4,159 | 5,236 | 6,063 |
| 1993 | 6,481 | 4,595 | 5,178 | 3,745 | 3,593 | 4,350 | 4,087 | 4,456 | 5,258 | 6,141 | 6,523 | 7,268 |
| 1994 | 7,275 | 6,494 | 4,935 | 3,477 | 3,933 | 3,331 | 3,962 | 4,177 | 4,450 | 5,152 | 4,897 | 4,794 |
| 1995 | 5,473 | 5,367 | 4,125 | 3,410 | 2,545 | 2,347 | 3,203 | 3,296 | 3,634 | 4,517 | 4,731 | 5,672 |
| 1996 | 6,390 | 5,415 | 3,806 | 3,507 | 3,761 | 3,111 | 2,874 | 4,241 | 3,424 | 4,217 | 5,106 | 6,177 |
| 1997 | 6,049 | 4,629 | 3,280 | 2,685 | 3,280 | 2,489 | 3,534 | 3,603 | 3,730 | 3,745 | 4,352 | 6,409 |
| 1998 | 4,920 | 3,136 | 4,443 | 2,956 | 1,964 | 2,287 | 2,163 | 2,333 | 3,119 | 3,782 | 3,956 | 4,379 |
| 1999 | 5,955 | 3,332 | 3,465 | 2,730 | 2,961 | 2,812 | 2,583 | 2,390 | 2,798 | 4,643 | 4,987 | 5,506 |
| 2000 | 4,851 | 4,285 | 4,253 | 2,246 | 2,422 | 2,328 | 2,704 | 3,258 | 3,790 | 4,384 | 4,994 | 5,221 |
| 2001 | 5,664 | 4,218 | 3,759 | 3,415 | 2,864 | 2,614 | 3,037 | 2,972 | 3,749 | 4,247 | 4,832 | 5,340 |
| 2002 | 5,052 | 3,771 | 2,435 | 2,095 | 2,245 | 1,962 | 2,140 | 2,739 | 2,926 | 4,285 | 4,132 | 5,132 |
| 2003 | 6,489 | 5,425 | 4,449 | 2,740 | 2,087 | 2,906 | 3,268 | 4,408 | 4,153 | 5,168 | 5,192 | 5,611 |
| 2004 | 7,088 | 5,681 | 4,715 | 3,352 | 3,782 | 3,225 | 3,121 | 3,299 | 5,172 | 5,753 | 5,111 | 5,882 |
| 2005 | 7,431 | 5,670 | 5,149 | 4,613 | 4,134 | 3,941 | 4,314 | 4,242 | 3,761 | 6,578 | 6,392 | 7,622 |
| 2006 | 7,724 | 4,901 | 5,208 | 4,061 | 2,975 | 3,243 | 3,344 | 3,333 | 3,135 | 4,408 | 5,040 | 5,850 |
| 2007 | 4,529 | 4,930 | 4,890 | 3,847 | 3,803 | 3,132 | 3,864 | 3,381 | 3,446 | 4,517 | 5,467 | 6,284 |
| 2008 | 6,585 | 5,503 | 6,037 | 4,074 | 3,879 | 3,785 | 3,928 | 3,347 | 4,692 | 5,077 | 6,285 | 7,726 |
| 2009 | 7,528 | 7,916 | 5,998 | 3,907 | 4,632 | 4,272 | 4,128 | 4,035 | 4,425 | 5,573 | 7,317 | 8,599 |
| 2010 | 8,415 | 5,676 | 5,166 | 3,891 | 3,875 | 3,381 | 3,760 | 3,962 | 4,276 | 5,383 | 5,983 | 7,477 |
| 2011 | 8,228 | 5,412 | 5,539 | 4,700 | 4,778 | 4,195 | 4,951 | 4,593 | 5,291 | 6,313 | 6,354 | 6,192 |
| 2012 | 6,062 | 4,312 | 3,056 | 3,392 | 3,613 | 3,241 | 3,561 | 3,707 | 4,218 | 4,410 | 5,678 | 5,355 |
| 2013 | 4,610 | 5,241 | 4,208 | 3,779 | 3,550 | 3,458 | 2,776 | 3,122 | 3,506 | 4,016 | 3,956 | 4,569 |
| 2014 | 4,659 | 4,331 | 3,628 | 2,350 | 1,773 | 1,988 | 2,577 | 2,207 | 2,584 | 2,827 | 3,499 | 3,857 |
| 2015 | 3,110 | 3,185 | 2,497 | 2,002 | 2,080 | 1,720 | 2,035 | 2,160 | 2,548 | 2,721 | 2,919 | 2,772 |
| 2016 | 3,412 | 2,589 | 2,392 | 1,684 | 1,834 | 1,438 | 1,904 | 1,719 | 2,028 | 2,611 | 3,009 | 3,074 |
| 2017 | 3,324 | 2,529 | 2,048 | 1,797 | 1,827 | 1,634 | 1,855 | 2,129 | 2,347 | 2,451 | 2,169 | 2,610 |
| 2018 | 3,680 | 2,718 | 2,029 | 2,097 | 1,914 | 1,684 | 1,906 | 2,403 | 2,593 | 2,468 | 2,504 | 3,083 |
| 2019 | 3,744 | 2,717 | 2,550 | 2,140 | 2,026 | 2,343 | 2,703 | 2,449 | 2,197 | 2,671 | 3,308 | 3,897 |
| 2020 | 3,411 | 2,513 | 2,140 | 1,986 | 2,609 | 2,342 | 2,316 | 1,945 | 1,914 | 2,746 | 2,299 | 2,201 |
| 2021 | 2,760 | 1,720 | 2,816 | 1,448 | 1,748 | 1,735 | 3,069 | 4,339 | 4,397 | 4,282 | 4,759 | 4,654 |
| 2022 | -- | -- | -- | -- | -- | -- | -- | -- | -- | -- | -- | -- |
| 2023 | -- | -- | -- | -- | -- | -- | -- | -- | -- | -- | -- | -- |
| 2024 | -- | |||||||||||
| - = No Data Reported; -- = Not Applicable; NA = Not Available; W = Withheld to avoid disclosure of individual company data. |
| Release Date: 3/29/2024 |
| Next Release Date: 4/30/2024 |