|
Download Data (XLS File) |
|
||||||||
|
||||||||
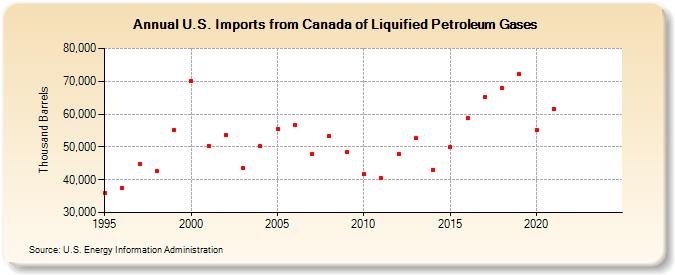
| U.S. Imports from Canada of Liquified Petroleum Gases (Thousand Barrels) | ||||||||
| Decade | Year-0 | Year-1 | Year-2 | Year-3 | Year-4 | Year-5 | Year-6 | Year-7 | Year-8 | Year-9 |
|---|---|---|---|---|---|---|---|---|---|---|
| 1990's | 36,047 | 37,595 | 44,847 | 42,765 | 55,130 | |||||
| 2000's | 70,145 | 50,282 | 53,694 | 43,425 | 50,120 | 55,491 | 56,643 | 47,977 | 53,191 | 48,299 |
| 2010's | 41,684 | 40,404 | 47,818 | 52,628 | 43,059 | 50,087 | 58,681 | 65,275 | 67,917 | 72,173 |
| 2020's | 55,101 | 61,649 | -- | -- |
| - = No Data Reported; -- = Not Applicable; NA = Not Available; W = Withheld to avoid disclosure of individual company data. |
| Release Date: 3/29/2024 |
| Next Release Date: 8/30/2024 |