|
Download Data (XLS File) |
|
||||||||
|
||||||||
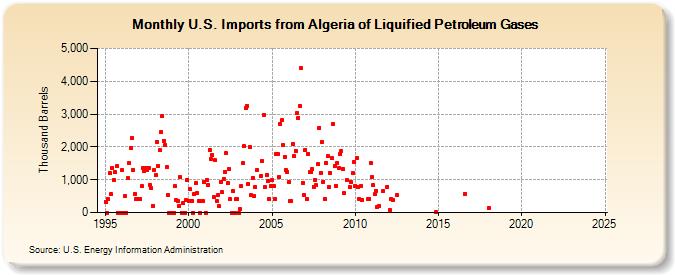
| U.S. Imports from Algeria of Liquified Petroleum Gases (Thousand Barrels) | ||||||||
| Year | Jan | Feb | Mar | Apr | May | Jun | Jul | Aug | Sep | Oct | Nov | Dec |
|---|---|---|---|---|---|---|---|---|---|---|---|---|
| 1995 | 336 | 0 | 402 | 1,198 | 551 | 1,365 | 987 | 1,235 | 1,407 | 0 | 0 | 0 |
| 1996 | 1,299 | 0 | 490 | 0 | 1,050 | 1,501 | 1,959 | 2,267 | 1,293 | 572 | 400 | 400 |
| 1997 | 400 | 400 | 794 | 1,346 | 1,252 | 1,369 | 1,294 | 1,368 | 845 | 733 | 210 | 1,311 |
| 1998 | 1,139 | 2,158 | 1,423 | 1,898 | 2,442 | 2,928 | 2,189 | 2,067 | 1,377 | 522 | 0 | 0 |
| 1999 | 0 | 0 | 799 | 374 | 362 | 210 | 1,088 | 0 | 298 | 0 | 377 | 1,005 |
| 2000 | 354 | 706 | 354 | 0 | 563 | 888 | 603 | 354 | 0 | 365 | 365 | 920 |
| 2001 | 0 | 999 | 850 | 1,907 | 1,627 | 1,752 | 468 | 1,593 | 355 | 524 | 197 | 921 |
| 2002 | 617 | 1,029 | 1,244 | 1,800 | 892 | 1,322 | 399 | 0 | 649 | 0 | 398 | 399 |
| 2003 | 0 | 105 | 799 | 1,502 | 2,016 | 3,179 | 3,254 | 869 | 1,990 | 525 | 1,062 | 511 |
| 2004 | 777 | 1,289 | 1,111 | 1,572 | 2,985 | 777 | 1,139 | 959 | 414 | 814 | ||
| 2005 | 991 | 815 | 404 | 1,777 | 1,771 | 1,069 | 2,706 | 2,817 | 2,044 | 1,703 | 1,294 | 1,231 |
| 2006 | 929 | 366 | 345 | 2,093 | 1,722 | 1,884 | 3,034 | 2,892 | 3,258 | 4,392 | 910 | 528 |
| 2007 | 1,914 | 414 | 1,797 | 1,225 | 1,246 | 1,325 | 792 | 1,002 | 828 | 1,468 | 2,588 | 1,208 |
| 2008 | 2,155 | 940 | 415 | 1,511 | 1,714 | 782 | 1,212 | 1,655 | 2,712 | 1,412 | 819 | 1,512 |
| 2009 | 1,347 | 1,788 | 1,865 | 1,338 | 584 | 980 | 764 | 935 | 1,203 | 1,551 | ||
| 2010 | 813 | 1,656 | 789 | 415 | 805 | 388 | 416 | 414 | 1,510 | |||
| 2011 | 1,083 | 829 | 555 | 664 | 165 | 214 | 662 | 784 | ||||
| 2012 | 63 | 412 | 373 | 548 | ||||||||
| 2014 | 13 | |||||||||||
| 2016 | 577 | |||||||||||
| 2018 | 140 | |||||||||||
| 2022 | -- | |||||||||||
| - = No Data Reported; -- = Not Applicable; NA = Not Available; W = Withheld to avoid disclosure of individual company data. |
| Release Date: 3/29/2024 |
| Next Release Date: 4/30/2024 |