|
Download Data (XLS File) |
|
||||||||
|
||||||||
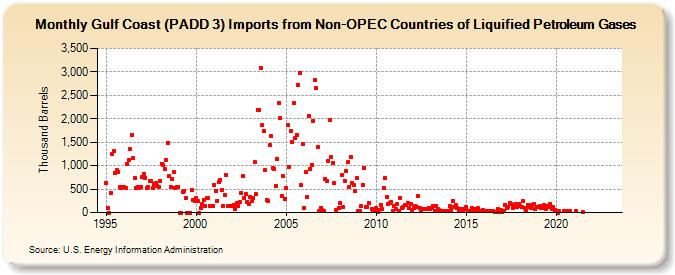
| Gulf Coast (PADD 3) Imports from Non-OPEC Countries of Liquified Petroleum Gases (Thousand Barrels) | ||||||||
| Year | Jan | Feb | Mar | Apr | May | Jun | Jul | Aug | Sep | Oct | Nov | Dec |
|---|---|---|---|---|---|---|---|---|---|---|---|---|
| 1995 | 626 | 100 | 0 | 423 | 1,247 | 1,309 | 851 | 908 | 865 | 542 | 525 | 543 |
| 1996 | 543 | 529 | 1,030 | 1,118 | 1,347 | 1,663 | 1,153 | 741 | 525 | 543 | 525 | 543 |
| 1997 | 753 | 827 | 740 | 525 | 543 | 675 | 668 | 525 | 606 | 628 | 573 | 543 |
| 1998 | 680 | 1,039 | 1,004 | 932 | 1,122 | 1,490 | 778 | 543 | 713 | 855 | 525 | 543 |
| 1999 | 543 | 0 | 0 | 442 | 468 | 304 | 0 | 0 | 0 | 487 | 275 | 250 |
| 2000 | 311 | 250 | 0 | 100 | 180 | 278 | 150 | 310 | 300 | 150 | 150 | 150 |
| 2001 | 593 | 450 | 257 | 661 | 696 | 481 | 150 | 375 | 797 | 150 | 150 | 150 |
| 2002 | 136 | 167 | 85 | 203 | 146 | 217 | 420 | 776 | 319 | 399 | 231 | 187 |
| 2003 | 341 | 241 | 320 | 1,077 | 386 | 2,195 | 2,188 | 3,088 | 1,857 | 1,736 | 905 | 274 |
| 2004 | 253 | 1,431 | 1,623 | 940 | 920 | 562 | 1,138 | 2,340 | 2,013 | 361 | 771 | 297 |
| 2005 | 526 | 1,870 | 979 | 1,746 | 1,514 | 2,340 | 1,579 | 1,653 | 2,728 | 2,969 | 579 | 1,458 |
| 2006 | 107 | 869 | 339 | 2,066 | 934 | 1,007 | 1,946 | 2,818 | 2,651 | 1,397 | 37 | 106 |
| 2007 | 55 | 36 | 709 | 677 | 1,099 | 1,972 | 1,174 | 1,064 | 624 | 56 | 98 | |
| 2008 | 197 | 800 | 124 | 676 | 884 | 1,072 | 555 | 1,179 | 621 | 596 | 453 | 738 |
| 2009 | 31 | 38 | 133 | 590 | 959 | 118 | 128 | 211 | 76 | 27 | 64 | |
| 2010 | 90 | 18 | 60 | 166 | 67 | 520 | 734 | 336 | 187 | 207 | 227 | 36 |
| 2011 | 130 | 66 | 191 | 27 | 311 | 106 | 129 | 153 | 164 | 207 | 95 | 189 |
| 2012 | 56 | 102 | 146 | 115 | 351 | 95 | 50 | 85 | 69 | 75 | 75 | 99 |
| 2013 | 86 | 94 | 141 | 34 | 133 | 81 | 45 | 27 | 34 | 34 | 35 | 34 |
| 2014 | 35 | 131 | 48 | 253 | 126 | 151 | 99 | 34 | 67 | 76 | 40 | 66 |
| 2015 | 109 | 36 | 40 | 37 | 89 | 34 | 70 | 35 | 88 | 42 | 53 | |
| 2016 | 36 | 32 | 30 | 43 | 33 | 8 | 11 | 80 | 5 | 44 | ||
| 2017 | 10 | 42 | 167 | 101 | 124 | 203 | 179 | 106 | 160 | 183 | 115 | 177 |
| 2018 | 145 | 113 | 237 | 103 | 34 | 171 | 112 | 105 | 154 | 173 | 71 | 111 |
| 2019 | 136 | 100 | 97 | 158 | 85 | 130 | 110 | 192 | 76 | 108 | 58 | |
| 2020 | 33 | 0 | 33 | 32 | 33 | 29 | ||||||
| 2021 | 32 | 22 | ||||||||||
| 2022 | -- | -- | -- | |||||||||
| 2023 | -- | -- | ||||||||||
| - = No Data Reported; -- = Not Applicable; NA = Not Available; W = Withheld to avoid disclosure of individual company data. |
| Release Date: 6/28/2024 |
| Next Release Date: 7/31/2024 |