|
Download Data (XLS File) |
|
||||||||
|
||||||||
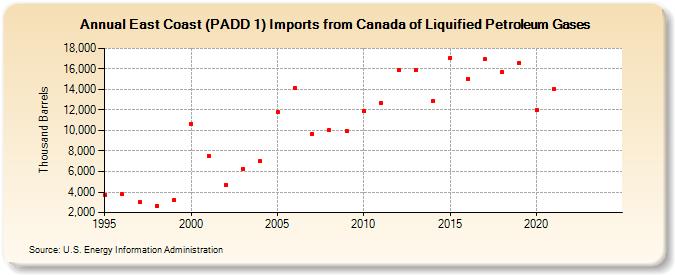
| East Coast (PADD 1) Imports from Canada of Liquified Petroleum Gases (Thousand Barrels) | ||||||||
| Decade | Year-0 | Year-1 | Year-2 | Year-3 | Year-4 | Year-5 | Year-6 | Year-7 | Year-8 | Year-9 |
|---|---|---|---|---|---|---|---|---|---|---|
| 1990's | 3,751 | 3,795 | 2,993 | 2,647 | 3,224 | |||||
| 2000's | 10,675 | 7,529 | 4,717 | 6,289 | 6,985 | 11,781 | 14,144 | 9,693 | 10,008 | 9,949 |
| 2010's | 11,897 | 12,712 | 15,935 | 15,907 | 12,870 | 17,091 | 15,054 | 16,918 | 15,696 | 16,612 |
| 2020's | 11,989 | 14,041 | -- | -- |
| - = No Data Reported; -- = Not Applicable; NA = Not Available; W = Withheld to avoid disclosure of individual company data. |
| Release Date: 3/29/2024 |
| Next Release Date: 8/30/2024 |