|
Download Data (XLS File) |
|
||||||||
|
||||||||
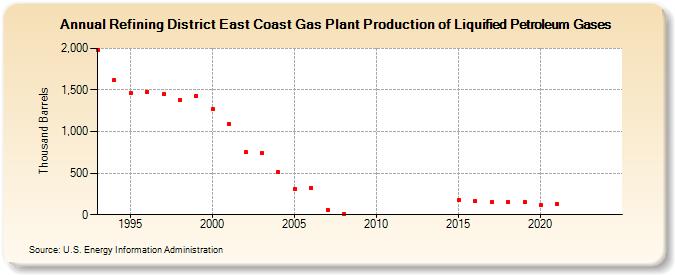
| Refining District East Coast Gas Plant Production of Liquified Petroleum Gases (Thousand Barrels) | ||||||||
| Decade | Year-0 | Year-1 | Year-2 | Year-3 | Year-4 | Year-5 | Year-6 | Year-7 | Year-8 | Year-9 |
|---|---|---|---|---|---|---|---|---|---|---|
| 1990's | 1,984 | 1,619 | 1,458 | 1,481 | 1,450 | 1,381 | 1,433 | |||
| 2000's | 1,271 | 1,091 | 750 | 741 | 508 | 307 | 327 | 61 | 14 | |
| 2010's | 175 | 165 | 154 | 157 | 156 | |||||
| 2020's | 119 | 130 | -- | -- |
| - = No Data Reported; -- = Not Applicable; NA = Not Available; W = Withheld to avoid disclosure of individual company data. |
| Release Date: 6/28/2024 |
| Next Release Date: 8/30/2024 |