|
Download Data (XLS File) |
|
||||||||
|
||||||||
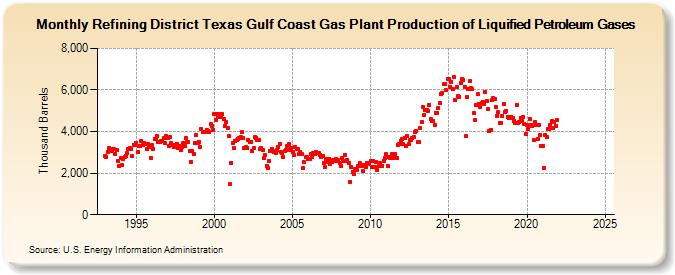
| Refining District Texas Gulf Coast Gas Plant Production of Liquified Petroleum Gases (Thousand Barrels) | ||||||||
| Year | Jan | Feb | Mar | Apr | May | Jun | Jul | Aug | Sep | Oct | Nov | Dec |
|---|---|---|---|---|---|---|---|---|---|---|---|---|
| 1993 | 2,834 | 2,790 | 3,032 | 3,194 | 3,133 | 3,058 | 3,162 | 3,145 | 2,938 | 3,121 | 2,581 | 2,357 |
| 1994 | 2,710 | 2,380 | 2,664 | 2,774 | 2,817 | 2,949 | 3,163 | 3,195 | 3,183 | 2,820 | 3,367 | 3,364 |
| 1995 | 3,426 | 3,006 | 3,289 | 3,282 | 3,537 | 3,351 | 3,444 | 3,422 | 3,146 | 3,412 | 3,253 | 2,751 |
| 1996 | 3,340 | 3,175 | 3,665 | 3,623 | 3,766 | 3,488 | 3,513 | 3,558 | 3,535 | 3,688 | 3,453 | 3,763 |
| 1997 | 3,694 | 3,291 | 3,715 | 3,428 | 3,340 | 3,269 | 3,371 | 3,397 | 3,222 | 3,324 | 3,112 | 3,234 |
| 1998 | 3,447 | 3,318 | 3,682 | 3,477 | 3,492 | 3,076 | 2,546 | 3,060 | 2,926 | 3,442 | 3,835 | 3,454 |
| 1999 | 3,512 | 3,267 | 4,112 | 4,001 | 3,956 | 3,999 | 4,096 | 4,023 | 3,961 | 4,350 | 4,257 | 4,092 |
| 2000 | 4,826 | 4,565 | 4,840 | 4,721 | 4,838 | 4,692 | 4,830 | 4,603 | 4,286 | 4,458 | 4,166 | 3,796 |
| 2001 | 1,498 | 2,497 | 3,446 | 3,225 | 3,525 | 3,574 | 3,638 | 3,674 | 3,737 | 3,960 | 3,683 | 3,227 |
| 2002 | 3,234 | 3,202 | 3,615 | 3,499 | 3,504 | 3,070 | 3,195 | 3,717 | 3,684 | 3,590 | 3,598 | 3,164 |
| 2003 | 3,211 | 3,107 | 2,708 | 2,871 | 2,357 | 2,223 | 2,598 | 3,068 | 3,184 | 3,058 | 2,996 | 2,945 |
| 2004 | 3,096 | 3,239 | 3,393 | 2,993 | 2,986 | 2,784 | 3,052 | 3,107 | 3,301 | 3,379 | 3,106 | 3,193 |
| 2005 | 3,000 | 2,865 | 3,235 | 3,172 | 3,155 | 2,932 | 3,028 | 2,906 | 2,250 | 2,515 | 2,758 | 2,764 |
| 2006 | 2,695 | 2,683 | 2,915 | 2,765 | 2,965 | 2,899 | 3,027 | 2,980 | 2,945 | 2,858 | 2,784 | 2,817 |
| 2007 | 2,491 | 2,310 | 2,679 | 2,543 | 2,673 | 2,461 | 2,554 | 2,655 | 2,581 | 2,658 | 2,565 | 2,649 |
| 2008 | 2,466 | 2,323 | 2,738 | 2,588 | 2,887 | 2,593 | 2,629 | 2,488 | 1,596 | 2,305 | 2,052 | 1,955 |
| 2009 | 2,190 | 2,147 | 2,341 | 2,345 | 2,470 | 2,363 | 2,088 | 2,405 | 2,310 | 2,478 | 2,444 | 2,489 |
| 2010 | 2,596 | 2,276 | 2,564 | 2,272 | 2,515 | 2,148 | 2,323 | 2,480 | 2,343 | 2,348 | 2,607 | 2,747 |
| 2011 | 2,900 | 2,355 | 2,771 | 2,749 | 2,907 | 2,710 | 2,835 | 2,913 | 2,711 | 3,366 | 3,390 | 3,530 |
| 2012 | 3,632 | 3,412 | 3,712 | 3,284 | 3,789 | 3,402 | 3,586 | 3,587 | 3,709 | 3,759 | 3,965 | 4,011 |
| 2013 | 3,490 | 3,484 | 4,156 | 4,474 | 5,191 | 4,798 | 5,058 | 5,058 | 4,978 | 5,279 | 4,583 | 4,527 |
| 2014 | 4,517 | 4,307 | 4,916 | 4,911 | 5,130 | 5,351 | 5,810 | 5,851 | 6,285 | 6,284 | 5,983 | 6,517 |
| 2015 | 6,525 | 6,162 | 6,398 | 6,060 | 6,623 | 5,524 | 6,134 | 5,728 | 5,685 | 6,340 | 6,540 | 6,482 |
| 2016 | 6,147 | 3,765 | 5,641 | 6,042 | 6,412 | 6,112 | 6,046 | 4,900 | 4,561 | 5,268 | 5,805 | 5,315 |
| 2017 | 5,186 | 5,393 | 5,440 | 5,335 | 5,923 | 5,464 | 5,105 | 4,015 | 4,095 | 5,525 | 5,597 | 5,561 |
| 2018 | 5,175 | 4,764 | 4,917 | 4,428 | 4,413 | 4,750 | 5,341 | 4,963 | 4,998 | 4,722 | 4,646 | 4,686 |
| 2019 | 4,698 | 4,649 | 4,499 | 4,402 | 5,274 | 4,426 | 4,471 | 4,636 | 4,498 | 4,703 | 4,354 | 3,871 |
| 2020 | 4,338 | 4,144 | 4,600 | 4,320 | 4,254 | 3,591 | 4,452 | 4,313 | 3,652 | 4,311 | 3,838 | 3,320 |
| 2021 | 3,321 | 2,261 | 3,847 | 3,725 | 4,141 | 4,123 | 4,332 | 4,487 | 4,169 | 4,481 | 4,267 | 4,544 |
| 2022 | -- | -- | -- | -- | -- | -- | -- | -- | -- | -- | -- | -- |
| 2023 | -- | -- | -- | -- | -- | -- | -- | -- | -- | -- | -- | -- |
| 2024 | -- | |||||||||||
| - = No Data Reported; -- = Not Applicable; NA = Not Available; W = Withheld to avoid disclosure of individual company data. |
| Release Date: 3/29/2024 |
| Next Release Date: 4/30/2024 |