|
Download Data (XLS File) |
|
||||||||
|
||||||||
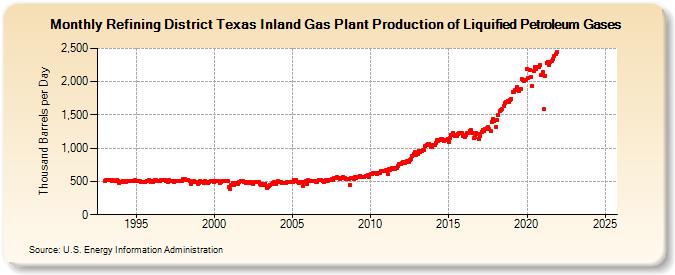
| Refining District Texas Inland Gas Plant Production of Liquified Petroleum Gases (Thousand Barrels per Day) | ||||||||
| Year | Jan | Feb | Mar | Apr | May | Jun | Jul | Aug | Sep | Oct | Nov | Dec |
|---|---|---|---|---|---|---|---|---|---|---|---|---|
| 1993 | 500 | 518 | 517 | 524 | 519 | 511 | 515 | 507 | 513 | 527 | 507 | 478 |
| 1994 | 493 | 498 | 509 | 508 | 499 | 507 | 508 | 510 | 513 | 504 | 513 | 515 |
| 1995 | 502 | 511 | 505 | 508 | 492 | 491 | 497 | 499 | 511 | 514 | 523 | 496 |
| 1996 | 509 | 496 | 516 | 520 | 510 | 502 | 513 | 523 | 517 | 526 | 522 | 508 |
| 1997 | 489 | 516 | 511 | 506 | 500 | 485 | 500 | 508 | 509 | 510 | 514 | 513 |
| 1998 | 530 | 531 | 521 | 529 | 517 | 500 | 467 | 493 | 500 | 495 | 499 | 468 |
| 1999 | 482 | 500 | 496 | 498 | 483 | 504 | 498 | 479 | 499 | 504 | 505 | 503 |
| 2000 | 499 | 507 | 505 | 504 | 484 | 498 | 503 | 510 | 507 | 505 | 501 | 420 |
| 2001 | 382 | 449 | 481 | 452 | 483 | 481 | 467 | 489 | 503 | 510 | 500 | 491 |
| 2002 | 479 | 496 | 493 | 483 | 485 | 483 | 469 | 490 | 495 | 486 | 498 | 459 |
| 2003 | 448 | 467 | 448 | 462 | 408 | 415 | 430 | 449 | 463 | 473 | 486 | 463 |
| 2004 | 490 | 500 | 495 | 489 | 473 | 471 | 481 | 484 | 489 | 496 | 492 | 485 |
| 2005 | 495 | 516 | 514 | 515 | 498 | 484 | 497 | 486 | 428 | 493 | 504 | 463 |
| 2006 | 518 | 513 | 511 | 510 | 501 | 504 | 497 | 494 | 522 | 518 | 518 | 514 |
| 2007 | 493 | 512 | 519 | 513 | 527 | 527 | 534 | 525 | 545 | 559 | 560 | 554 |
| 2008 | 542 | 556 | 557 | 572 | 559 | 540 | 539 | 538 | 448 | 550 | 553 | 535 |
| 2009 | 560 | 552 | 570 | 574 | 585 | 574 | 562 | 565 | 576 | 584 | 595 | 574 |
| 2010 | 607 | 616 | 626 | 620 | 626 | 612 | 626 | 630 | 651 | 650 | 653 | 663 |
| 2011 | 666 | 605 | 688 | 677 | 698 | 684 | 700 | 690 | 707 | 739 | 765 | 766 |
| 2012 | 780 | 787 | 776 | 796 | 804 | 799 | 824 | 841 | 885 | 917 | 944 | 903 |
| 2013 | 919 | 965 | 946 | 964 | 966 | 968 | 1,029 | 1,045 | 1,062 | 1,058 | 1,019 | 1,020 |
| 2014 | 1,049 | 1,055 | 1,072 | 1,116 | 1,106 | 1,129 | 1,131 | 1,136 | 1,111 | 1,123 | 1,120 | 1,144 |
| 2015 | 1,086 | 1,157 | 1,192 | 1,230 | 1,191 | 1,186 | 1,190 | 1,215 | 1,229 | 1,233 | 1,228 | 1,182 |
| 2016 | 1,173 | 1,198 | 1,233 | 1,234 | 1,256 | 1,267 | 1,232 | 1,153 | 1,165 | 1,232 | 1,212 | 1,145 |
| 2017 | 1,184 | 1,248 | 1,271 | 1,260 | 1,284 | 1,297 | 1,316 | 1,284 | 1,262 | 1,399 | 1,438 | 1,412 |
| 2018 | 1,320 | 1,418 | 1,493 | 1,553 | 1,575 | 1,588 | 1,637 | 1,682 | 1,694 | 1,703 | 1,694 | 1,725 |
| 2019 | 1,741 | 1,848 | 1,849 | 1,875 | 1,924 | 1,877 | 1,866 | 1,890 | 2,036 | 2,025 | 2,006 | 2,019 |
| 2020 | 2,194 | 2,053 | 2,176 | 2,074 | 1,939 | 2,160 | 2,223 | 2,197 | 2,222 | 2,224 | 2,249 | 2,097 |
| 2021 | 2,148 | 1,587 | 2,090 | 2,286 | 2,302 | 2,251 | 2,302 | 2,304 | 2,342 | 2,385 | 2,413 | 2,446 |
| 2022 | -- | -- | -- | -- | -- | -- | -- | -- | -- | -- | -- | -- |
| 2023 | -- | -- | -- | -- | -- | -- | -- | -- | -- | -- | -- | -- |
| 2024 | -- | |||||||||||
| - = No Data Reported; -- = Not Applicable; NA = Not Available; W = Withheld to avoid disclosure of individual company data. |
| Release Date: 3/29/2024 |
| Next Release Date: 4/30/2024 |