|
Download Data (XLS File) |
|
||||||||
|
||||||||
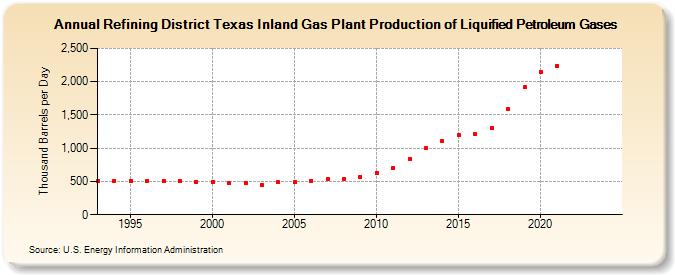
| Refining District Texas Inland Gas Plant Production of Liquified Petroleum Gases (Thousand Barrels per Day) | ||||||||
| Decade | Year-0 | Year-1 | Year-2 | Year-3 | Year-4 | Year-5 | Year-6 | Year-7 | Year-8 | Year-9 |
|---|---|---|---|---|---|---|---|---|---|---|
| 1990's | 511 | 507 | 504 | 513 | 505 | 504 | 496 | |||
| 2000's | 495 | 474 | 484 | 451 | 487 | 491 | 510 | 531 | 541 | 573 |
| 2010's | 632 | 700 | 838 | 997 | 1,108 | 1,193 | 1,208 | 1,305 | 1,591 | 1,913 |
| 2020's | 2,151 | 2,242 | -- | -- |
| - = No Data Reported; -- = Not Applicable; NA = Not Available; W = Withheld to avoid disclosure of individual company data. |
| Release Date: 8/30/2024 |
| Next Release Date: 8/29/2025 |