|
Download Data (XLS File) |
|
||||||||
|
||||||||
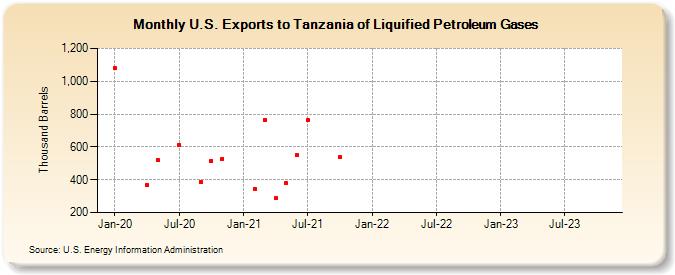
| U.S. Exports to Tanzania of Liquified Petroleum Gases (Thousand Barrels) | ||||||||
| Year | Jan | Feb | Mar | Apr | May | Jun | Jul | Aug | Sep | Oct | Nov | Dec |
|---|---|---|---|---|---|---|---|---|---|---|---|---|
| 2020 | 1,081 | 369 | 523 | 613 | 387 | 516 | 529 | |||||
| 2021 | 346 | 766 | 286 | 379 | 550 | 763 | 537 | |||||
| 2022 | -- | -- | -- | |||||||||
| 2023 | -- |
| - = No Data Reported; -- = Not Applicable; NA = Not Available; W = Withheld to avoid disclosure of individual company data. |
| Release Date: 6/28/2024 |
| Next Release Date: 7/31/2024 |