|
Download Data (XLS File) |
|
||||||||
|
||||||||
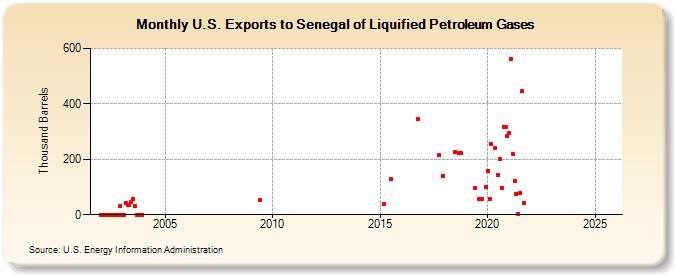
| U.S. Exports to Senegal of Liquified Petroleum Gases (Thousand Barrels) | ||||||||
| Year | Jan | Feb | Mar | Apr | May | Jun | Jul | Aug | Sep | Oct | Nov | Dec |
|---|---|---|---|---|---|---|---|---|---|---|---|---|
| 2002 | 0 | 0 | 0 | 0 | 0 | 0 | 0 | 0 | 0 | 0 | 0 | 32 |
| 2003 | 0 | 0 | 44 | 35 | 36 | 45 | 56 | 30 | 0 | 0 | 0 | 0 |
| 2009 | 52 | |||||||||||
| 2015 | 40 | 130 | ||||||||||
| 2016 | 346 | |||||||||||
| 2017 | 216 | 140 | ||||||||||
| 2018 | 227 | 223 | 222 | |||||||||
| 2019 | 97 | 57 | 57 | 55 | 101 | |||||||
| 2020 | 158 | 56 | 256 | 240 | 144 | 200 | 98 | 317 | 316 | 283 | ||
| 2021 | 295 | 560 | 219 | 120 | 75 | 3 | 77 | 445 | 44 | |||
| 2022 | -- | -- | -- | -- | -- | -- | -- | |||||
| 2023 | -- | -- | -- | |||||||||
| - = No Data Reported; -- = Not Applicable; NA = Not Available; W = Withheld to avoid disclosure of individual company data. |
| Release Date: 6/28/2024 |
| Next Release Date: 7/31/2024 |