|
Download Data (XLS File) |
|
||||||||
|
||||||||
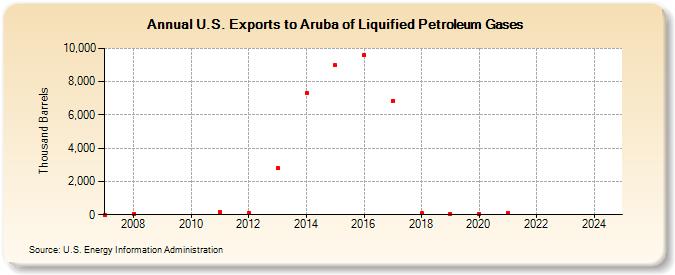
| U.S. Exports to Aruba of Liquified Petroleum Gases (Thousand Barrels) | ||||||||
| Decade | Year-0 | Year-1 | Year-2 | Year-3 | Year-4 | Year-5 | Year-6 | Year-7 | Year-8 | Year-9 |
|---|---|---|---|---|---|---|---|---|---|---|
| 2000's | 10 | 50 | ||||||||
| 2010's | 143 | 90 | 2,820 | 7,332 | 8,976 | 9,610 | 6,858 | 76 | 62 | |
| 2020's | 47 | 101 | -- | -- | -- |
| - = No Data Reported; -- = Not Applicable; NA = Not Available; W = Withheld to avoid disclosure of individual company data. |
| Release Date: 6/30/2025 |
| Next Release Date: 8/29/2025 |