|
Download Data (XLS File) |
|
||||||||
|
||||||||
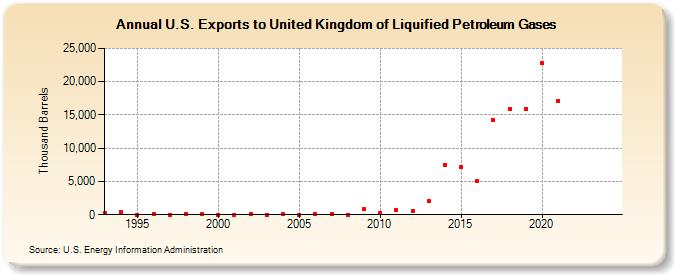
| U.S. Exports to United Kingdom of Liquified Petroleum Gases (Thousand Barrels) | ||||||||
| Decade | Year-0 | Year-1 | Year-2 | Year-3 | Year-4 | Year-5 | Year-6 | Year-7 | Year-8 | Year-9 |
|---|---|---|---|---|---|---|---|---|---|---|
| 1990's | 221 | 355 | 11 | 159 | 26 | 180 | 54 | |||
| 2000's | 23 | 22 | 49 | 24 | 39 | 24 | 107 | 43 | 29 | 814 |
| 2010's | 297 | 732 | 568 | 2,005 | 7,518 | 7,230 | 5,089 | 14,163 | 15,857 | 15,960 |
| 2020's | 22,750 | 17,108 | -- | -- |
| - = No Data Reported; -- = Not Applicable; NA = Not Available; W = Withheld to avoid disclosure of individual company data. |
| Release Date: 3/29/2024 |
| Next Release Date: 8/30/2024 |