|
Download Data (XLS File) |
|
||||||||
|
||||||||
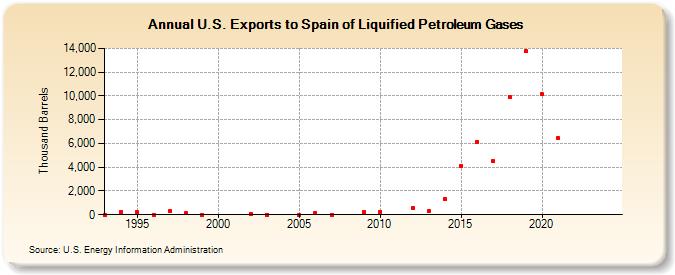
| U.S. Exports to Spain of Liquified Petroleum Gases (Thousand Barrels) | ||||||||
| Decade | Year-0 | Year-1 | Year-2 | Year-3 | Year-4 | Year-5 | Year-6 | Year-7 | Year-8 | Year-9 |
|---|---|---|---|---|---|---|---|---|---|---|
| 1990's | 1 | 192 | 199 | 1 | 310 | 115 | 2 | |||
| 2000's | 85 | 0 | 0 | 176 | 0 | 226 | ||||
| 2010's | 262 | 574 | 294 | 1,324 | 4,118 | 6,148 | 4,483 | 9,939 | 13,743 | |
| 2020's | 10,123 | 6,422 | -- | -- |
| - = No Data Reported; -- = Not Applicable; NA = Not Available; W = Withheld to avoid disclosure of individual company data. |
| Release Date: 4/30/2024 |
| Next Release Date: 8/30/2024 |