|
Download Data (XLS File) |
|
||||||||
|
||||||||
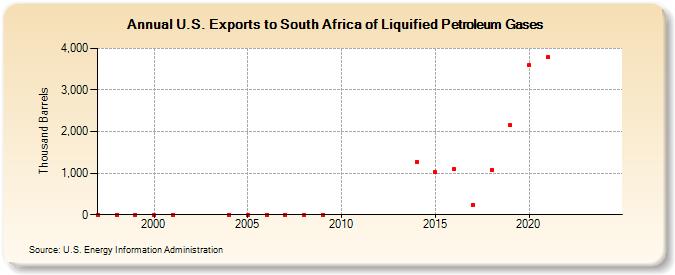
| U.S. Exports to South Africa of Liquified Petroleum Gases (Thousand Barrels) | ||||||||
| Decade | Year-0 | Year-1 | Year-2 | Year-3 | Year-4 | Year-5 | Year-6 | Year-7 | Year-8 | Year-9 |
|---|---|---|---|---|---|---|---|---|---|---|
| 1990's | 0 | 0 | 1 | |||||||
| 2000's | 4 | 0 | 0 | 0 | 1 | 0 | 0 | 0 | ||
| 2010's | 1,272 | 1,016 | 1,091 | 241 | 1,078 | 2,151 | ||||
| 2020's | 3,589 | 3,786 | -- | -- |
| - = No Data Reported; -- = Not Applicable; NA = Not Available; W = Withheld to avoid disclosure of individual company data. |
| Release Date: 3/29/2024 |
| Next Release Date: 8/30/2024 |